Part of: Technical Analysis
Ichimoku Cloud: Complicated, but Here's What Matters
A practical breakdown of Ichimoku Cloud trading: which of the five lines actually matter and when simpler indicators do the job just as well.
 Jake Morrison4 min read
Five Lines, Two That Matter
The first time I loaded an Ichimoku Cloud on my chart, I stared at it for ten minutes and then closed the tab. Five lines, a shaded cloud, and a lagging span that seemed to exist purely to make me feel stupid. I was trading AAPL at the time, around 2016, and I remember thinking "there is no way anyone actually uses this in real time."
I was wrong. But I was also half right. Most of what makes Ichimoku look intimidating is noise for the average swing trader. The system was designed by a Japanese journalist named Goichi Hosoda who spent 30 years refining it before publishing in 1969. It was meant to be a complete system. The problem is that most Western traders bolt it onto charts that already have moving averages, RSI, and MACD, which turns the screen into abstract art.
Here is the honest truth: two components carry most of the weight. The Kumo (cloud) and the Tenkan-sen/Kijun-sen cross. The rest is useful in specific contexts, but if you are just getting started, those two will get you 80% of the value.
The Cloud Is a Support/Resistance Zone
Think of the Kumo cloud as a dynamic support and resistance zone. It is calculated from the midpoints of the highest high and lowest low over 52 and 26 periods, then projected 26 periods forward. That forward projection is what makes it unique, you can see potential support and resistance areas before price gets there.
When price is above the cloud, the trend is bullish. Below, bearish. Inside the cloud, you are in no-man's-land.
The thickness of the cloud matters. A thick cloud after a sustained uptrend means strong support underneath. A thin cloud at a trend transition is a warning sign, price can slice through thin clouds like they are not there. I learned this the hard way on a TSLA trade in early 2021 when the cloud looked supportive but was paper-thin. Price dropped through it in two sessions.
Practical rule: if the cloud is thin at your expected support level, treat it as a weak level and tighten your stop.
The Tenkan/Kijun Cross
The Tenkan-sen (conversion line, 9-period midpoint) and Kijun-sen (base line, 26-period midpoint) form a crossover system similar to moving average crossovers. When the Tenkan crosses above the Kijun, that is a bullish signal. Below, bearish.
What makes it better than a simple 9/26 moving average cross? Midpoints respond differently to price than averages do. They are less sensitive to individual candle noise but snap faster when a genuine range expansion occurs.
The cross quality depends on where it happens relative to the cloud:
- Cross above the cloud: strong bullish signal
- Cross inside the cloud: neutral, wait for confirmation
- Cross below the cloud: weak bullish signal, higher risk trade
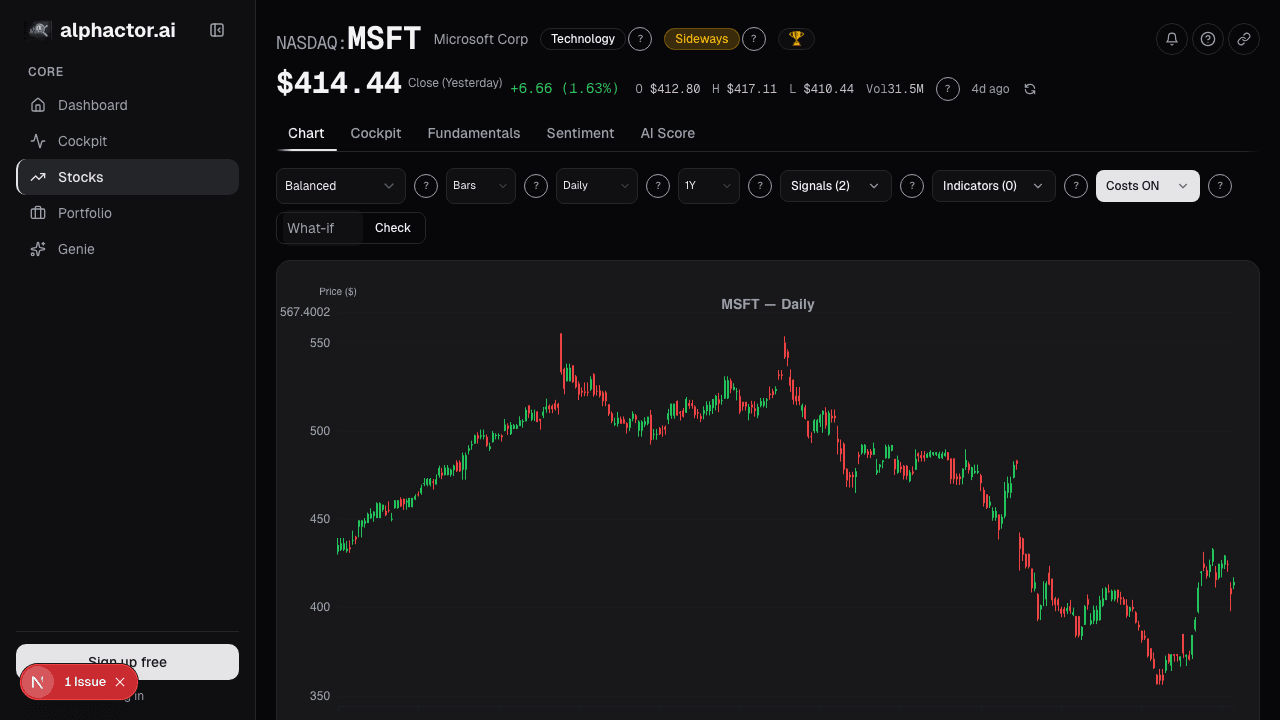
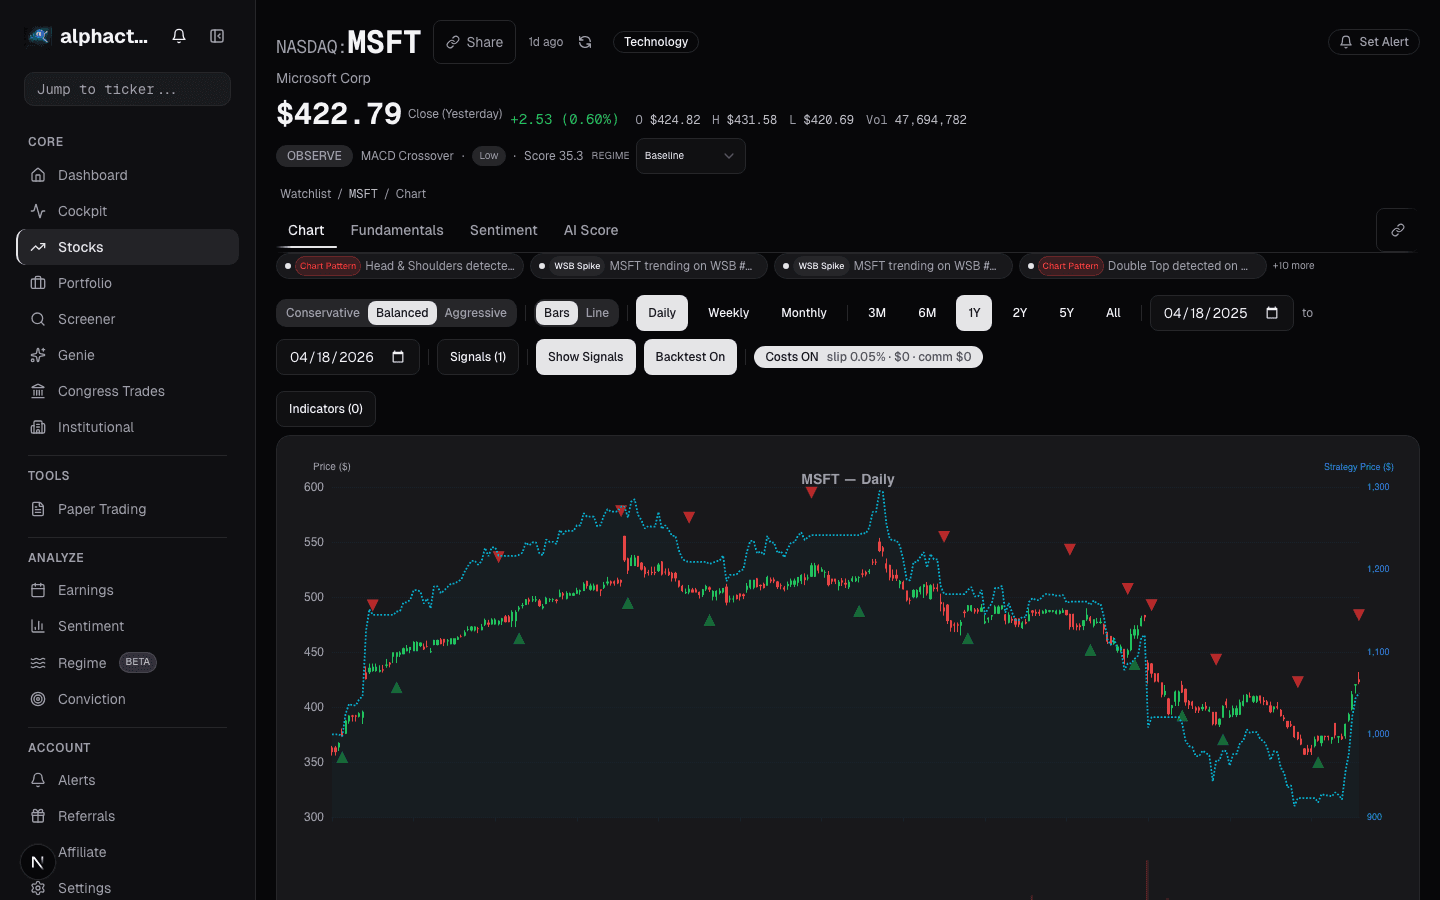
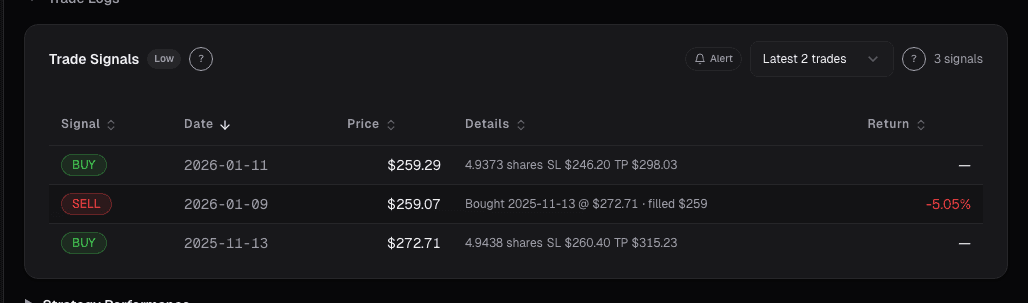
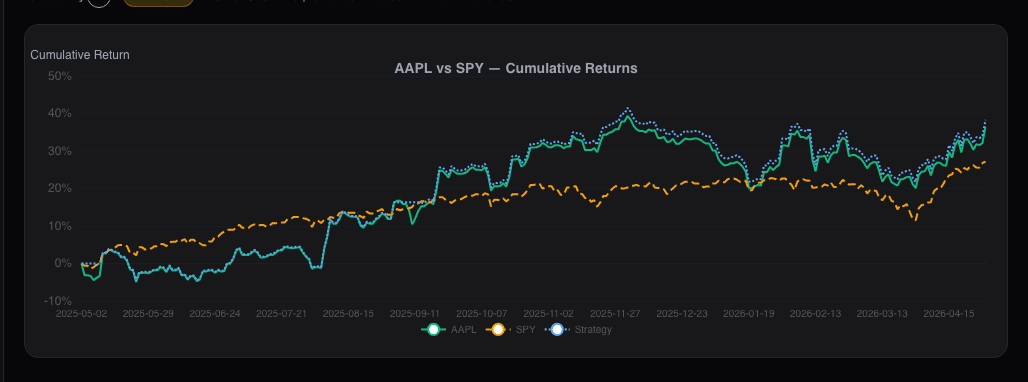
I have found the above-cloud cross to be the most reliable entry trigger on daily timeframes for large-cap stocks. On something like MSFT or GOOGL, a Tenkan/Kijun bullish cross above a thick cloud has historically preceded 2-4 week continuation moves with a decent win rate. You can validate this with Alphactor backtesting on specific stocks to see how cloud-based entries performed historically.
When Ichimoku Actually Adds Value
Ichimoku shines in trending markets on daily and weekly timeframes. If you trade trending stocks or ETFs and hold for days to weeks, the cloud gives you a dynamic trailing support zone that adapts better than a fixed moving average.
It is also useful for quick trend assessment. A single glance tells you trend direction (price vs cloud), momentum (Tenkan vs Kijun), and support strength (cloud thickness). That is a lot of information compressed into one indicator.
Where it falls apart: choppy, range-bound markets. If a stock has been trading sideways for months, the cloud flattens and the Tenkan/Kijun lines whipsaw. I stopped using Ichimoku on anything that does not have a clear directional bias after getting chopped up on XLE during a six-month consolidation in 2023.
When Simpler Tools Do the Job
If you are trading intraday or scalping, Ichimoku's default settings (9/26/52) are too slow. Some traders adjust the periods, but at that point you are essentially rebuilding the indicator and losing the benefit of standardized levels that other traders watch.
If you already have a 20 EMA and 50 EMA on your chart with RSI, adding Ichimoku is redundant. You are getting the same trend and momentum information with more visual clutter. The cloud does not provide magical insight that a well-placed moving average envelope cannot approximate.
My current approach: I use Ichimoku on weekly charts for position trades and ETF trend analysis. For everything else, I keep it simple with moving averages and volume. The universe scanner lets me filter by trend strength directly, so I do not need to visually scan hundreds of Ichimoku charts. The signal does the scanning, and I only pull up the cloud on Alphactor charts when I want to fine-tune an entry on something that already passed my filters.
The Bottom Line
Ichimoku Cloud is a legitimate, well-designed system. It is not magic, and it is not as complicated as it looks once you focus on the cloud and the Tenkan/Kijun cross. But it is also not necessary if your existing setup already covers trend direction and momentum. Learn it, understand what it tells you, and then decide whether it earns a spot on your charts based on your actual trading style, not because it looks sophisticated.
See it in the app
Live dashboard views that match this post. Each tile deep-links to the exact card.
Stocks mentioned
Related reading
5 Candlestick Patterns With Real Statistical Edge
Most candlestick patterns are noise. Research shows only a handful have measurable predictive power, and context matters more than the pattern itself.
Why Stacking 5 Indicators on Your Chart Is Making You Worse
Most traders use too many indicators that say the same thing. Learn how to pick 2-3 complementary indicators and reduce signal noise.
Fibonacci Retracements
An honest look at Fibonacci retracements in trading, why they seem to work, when they actually help, and the 61.8% level's mixed track record.
MACD Beyond Crossovers
The MACD histogram reveals momentum shifts before the signal line cross. Here is how to read it properly and combine it with volume.
SMA vs EMA vs WMA: Which Moving Average Actually Matters
A practical comparison of simple, exponential, and weighted moving averages with backtested data showing when each type works and when it does not.
RSI: The Most Misused Indicator in Retail Trading
Why buying at RSI 30 and selling at 70 loses money, and what RSI actually tells you about momentum, divergences, and failure swings.
Ready to try alphactor.ai?
Validate your trading strategies with statistical credibility testing. Start free.
Get Started Free