Blog
Guides, strategies, and insights for smarter stock analysis.
Browse by topic
197 posts
54 New Paper-Backed Alpha Families: Wave-7 Expansion
Alphactor added 54 paper-backed alpha families across filings, healthcare, macro, alt-data, and text themes, plus FDA MAUDE ingest. Registry now 320.
39 New Alpha Families: Wave-6 Alt-Data Expansion
Alphactor added 39 alternative-data alpha families across prediction markets, conflict events, weather, supply chains, patents, and drug safety.
GEX vs Max Pain: Two Magnets, Two Different Forces
Max gamma strike and max pain both produce magnet prices, but they read different forces. Knowing which to trust keeps you from over-fitting the wrong signal.
How AMERISAFE's 8-K Reveals Insurance Quality
Small-cap specialty insurers like AMSF report on loss ratios and reserve development, not just EPS. Reading the combined ratio correctly changes the analysis.
CME Group's 8-K Is Not a Press Release: How to Read an Item 2.02 Filing
An SEC 8-K under Item 2.02 contains primary earnings data, not a press release. CME's filing pattern makes it especially useful for rate-regime traders.
AMD Trending on StockTwits for the 40th Time This Year: How to Read Zero Information
AMD trending on StockTwits carries near-zero information content. Source quality and regime context matter far more than the presence of buzz.
Boeing on the Trending List: Why Put Skew Tells You More Than the Direction
When $BA trends on Yahoo, sentiment asymmetry in the options market often contains more signal than the headline story driving the click volume.
GEV on the Yahoo Trending List Tells You One Thing. ATR Tells You Everything Else.
GE Vernova's trending rank signals attention, not edge. Realized volatility and sector regime do the actual work of sizing a GEV position safely.
Accruals Quality: How to Spot Earnings That Aren't Real
Accruals measure the gap between reported earnings and actual cash. Widening accruals is one of the most reliable red flags in financial analysis, Sloan's…

Altman Z-Score: A Bankruptcy Predictor That Still Works
Edward Altman's 1968 discriminant model predicts bankruptcy within two years about 72% of the time at its distress threshold.
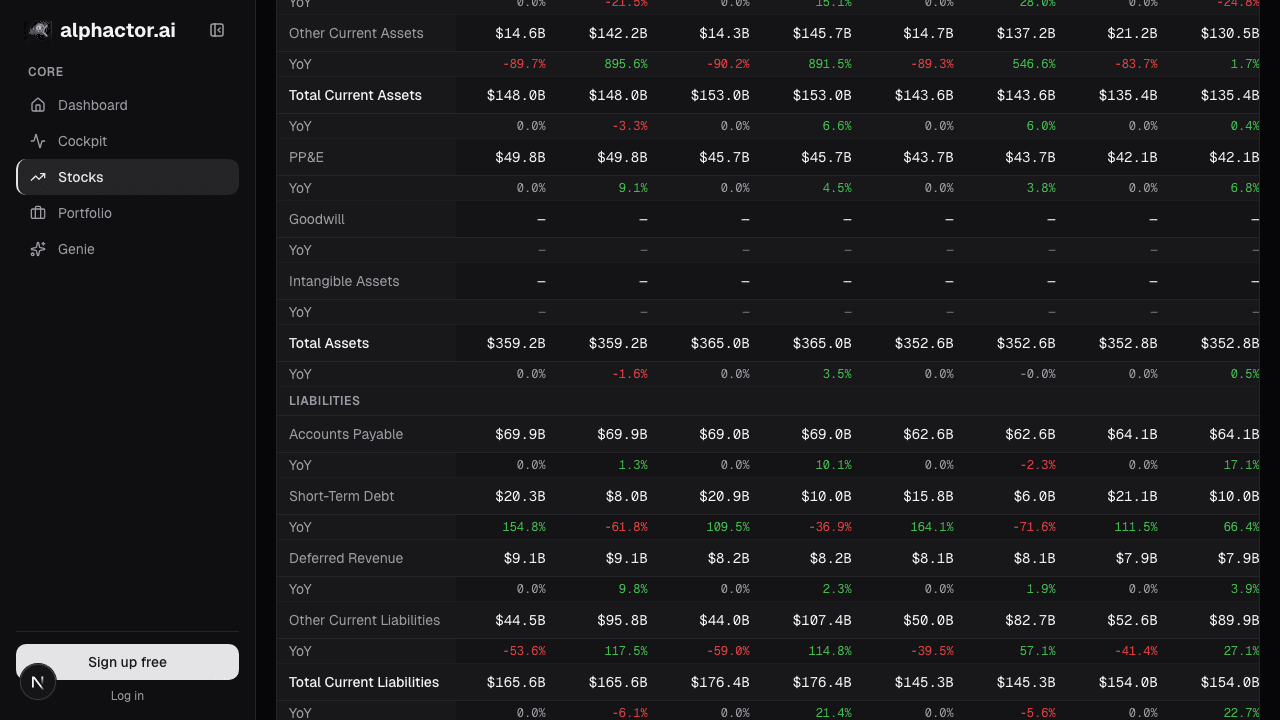
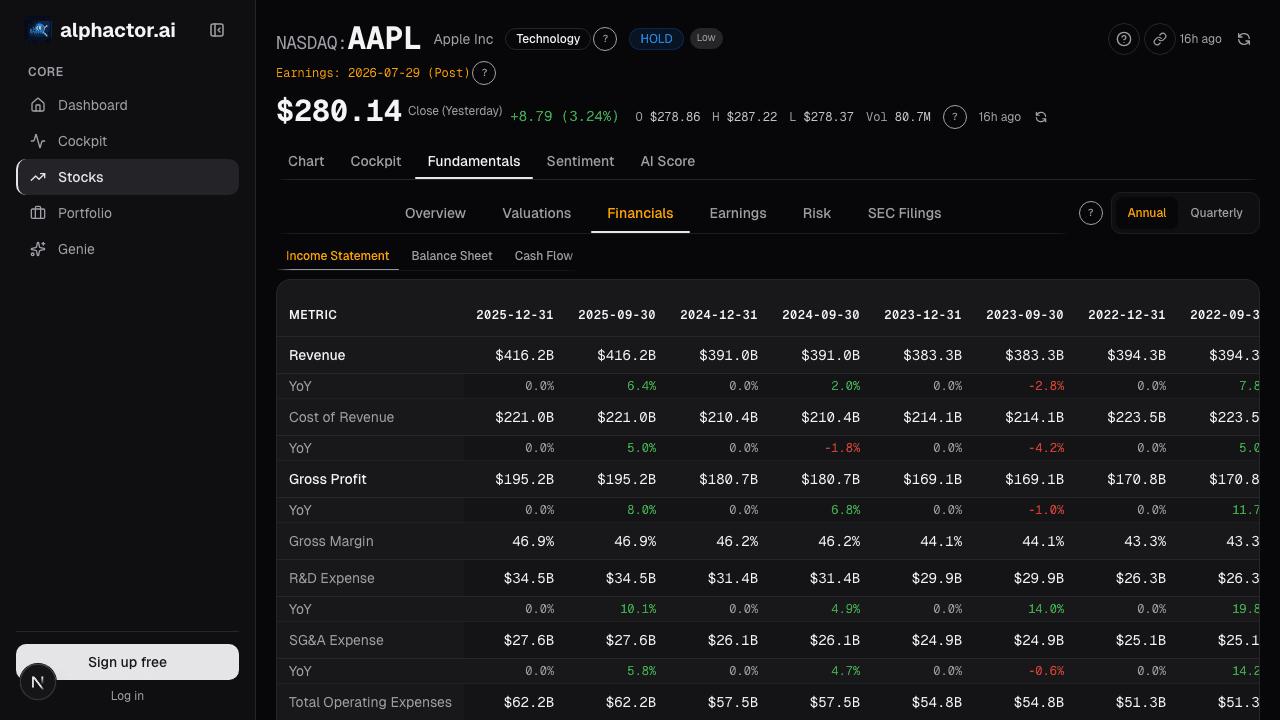
Balance Sheet Deep Dive
Balance sheet changes lead income statements by 2-6 quarters. Net debt, receivables days, and goodwill are the lines that move stocks first.
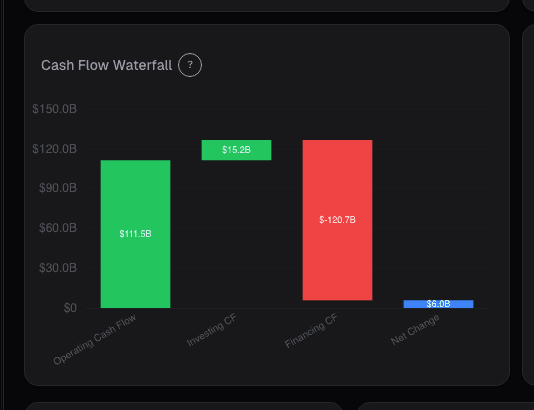
Cashflow Waterfall: From Operating Cash to Free Cash
Operating cash flow is cleaner than net income but still not distributable cash. The waterfall makes every deduction visible, SBC, working capital, capex …