Part of: Fundamental Analysis
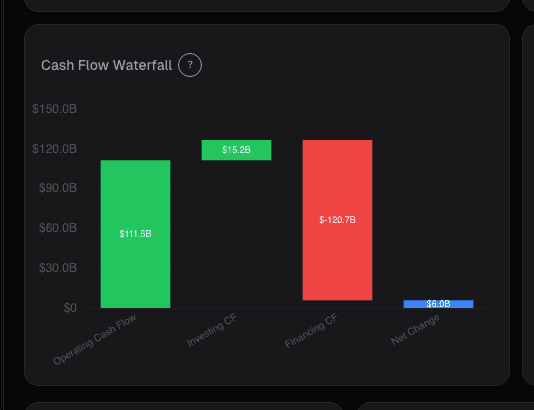
Cashflow Waterfall: From Operating Cash to Free Cash
Operating cash flow is cleaner than net income but still not distributable cash. The waterfall makes every deduction visible, SBC, working capital, capex …
 Sarah Patel7 min read
In 2019 a software company I'd been analyzing reported what looked like a blowout free cash flow quarter, FCF up 80% YoY. The initial write-up from the sell-side praised the "improved cash generation." When I pulled the cash flow statement apart, the story was different: operating cash flow was up modestly, but working capital had swung from a $40M use in the prior-year quarter to a $65M source in this one, meaning the quarter's "FCF improvement" was almost entirely a receivables collection pattern that would reverse in the next quarter. I flagged it in a client note as unsustainable. The next quarter FCF reverted exactly as predicted, and the stock took a double-digit hit on earnings day. The surprise wasn't in the operating business; it was in the fact that nobody had done the cash-flow-statement arithmetic the market was supposedly pricing.
This post is about the Cashflow Waterfall card, how to read each step honestly, and the three quality checks that separate sustainable free cash flow from quarterly noise.
TL;DR
- Operating cash flow includes non-recurring working capital swings. Quality FCF strips those out.
- SBC is a real cost dilution-wise even though it's added back to CFO. Adjust.
- Maintenance capex and growth capex aren't the same. FCF for distribution is after maintenance capex only.
- Working capital contribution > 30% of CFO is a yellow flag. Probably not repeatable.
- Read the waterfall TTM, not single quarters. Quarterly cash flows are noisy by construction.
Why CFO alone isn't FCF
Operating cash flow is a cleaner profitability measure than net income, it's less susceptible to accrual manipulation, inventory treatment choices, and depreciation schedule games. But it's not a distributable number. From CFO you still have to subtract:
- Maintenance capex: the spending required to keep the current business running. Depreciation is the accounting estimate; maintenance capex is the actual cash cost.
- Growth capex: spending to expand capacity. Economically different from maintenance because it's discretionary, but still real cash out the door.
- Working capital reversals: if you collected receivables aggressively this quarter, you probably released cash; next quarter that release doesn't repeat.
The cashflow waterfall makes each deduction visible instead of collapsing them into a single "free cash flow" number. That distinction matters: reported FCF can be clean, gamed, or a mix, and only the waterfall shows you which.
What the Cashflow Waterfall shows
The Cashflow Waterfall card starts at Net Income and walks right through the cash statement:
- Net Income (the accounting starting point)
- + D&A (non-cash charge added back)
- + Stock-based comp (non-cash to CFO, but real dilution)
- ± Working capital changes: broken into receivables, inventory, payables, deferred revenue
- ± Other operating items: typically modest
- = Operating Cash Flow
- – Capex: maintenance and growth separately when disclosed or estimable
- = Free Cash Flow
- ± Debt repayment / issuance
- – Dividends
- – Buybacks
- = Net Change in Cash
Each bar is sized to its dollar magnitude and colored by direction (green = cash in, red = cash out). TTM vs. same-period-prior-year toggle in one click. A quality-adjusted FCF line runs at the bottom of the chart showing FCF with SBC subtracted back out and non-recurring working capital swings smoothed.
Three quality checks
SBC as a percentage of CFO. Stock-based comp is added back to operating cash flow because it's non-cash. But SBC is a real economic cost, shareholders get diluted, future cash must be used to buy back shares to offset the dilution, or EPS-per-share degrades. Growth software companies frequently run SBC at 20–40% of operating cash flow. When a software name reports "FCF of $400M," you need to know that SBC was $150M of the run-rate, the real distributable FCF is closer to $250M. The card shows SBC as its own line and the quality-adjusted FCF line subtracts it back out, so the honest FCF is visible.
Working capital contribution. If working capital is contributing more than 30% of CFO in a given quarter, the benefit is probably non-recurring. Receivables can only drop to zero; once collected, they don't release cash again. Inventory can be drawn down, but the drawdown doesn't repeat indefinitely. Payables can be stretched, but only so far before suppliers push back. The quality-adjusted FCF line uses an 8-quarter rolling-average of working capital contribution rather than the point-in-time value, which smooths out the quarterly noise and shows the recurring level.
Capex intensity relative to revenue growth. Maintenance capex flat while revenue grows is a scalable business; maintenance capex rising faster than revenue is capex-hungry, and FCF margin will have trouble expanding. The waterfall shows capex as its own bar and, when the company discloses, splits maintenance from growth. For companies that don't split, a reasonable proxy is depreciation ≈ maintenance capex (depreciation is the accounting estimate of maintenance capex for a business in steady state).
What the waterfall can mask
- Acquisition-related cash flows. M&A changes everything below the FCF line and often distorts the comparison across periods. The card flags M&A periods so you can read through them.
- Deferred revenue dynamics in subscription businesses. A surge in deferred revenue collection pumps CFO in the quarter but doesn't correspond to economic revenue. The deferred revenue line in the working-capital breakdown is the piece to watch.
- Lease accounting changes (ASC 842 / IFRS 16) shifted operating lease payments between operating and financing activities mid-2010s. Long historical comparisons need to account for the treatment change.
Example: reading two software companies side by side
Two mid-cap software companies in early 2025:
| Metric | Company A | Company B |
|---|---|---|
| Revenue TTM | $850M | $820M |
| Reported FCF TTM | $185M | $175M |
| SBC as % of CFO | 38% | 14% |
| Working capital contribution | +$22M | -$8M |
| Quality-adjusted FCF | $95M | $150M |
On reported FCF, the two look similar. The quality-adjusted view reveals Company B is producing meaningfully more distributable cash per dollar of revenue. Company A's "FCF" is inflated by high SBC and a favorable working capital quarter that won't repeat; Company B's is the real thing. If I'm paying the same P/FCF multiple for both on reported numbers, I'm overpaying for A by about 60% on a quality-adjusted basis.
The waterfall is what surfaces this. Without the SBC and working capital breakouts, the two names look interchangeable.
Common mistakes
- Treating reported FCF as distributable cash. It isn't, on software names especially. SBC and working capital need to be reviewed.
- Reading a single quarter. Cash flow statements are quarterly-noisy by construction. TTM is the honest view.
- Ignoring maintenance vs. growth capex split. Distributable FCF is after maintenance capex; growth capex is discretionary and a separate question.
- Buying "high FCF yield" screens without checking quality. Many FCF-yield screens flag names with one-quarter working-capital reversals as cheap. They reverse.
- Treating SBC as "not really a cost." It's a cost. Shareholders pay for it in dilution or buyback absorption.
Where it fits
Use alongside FCF Yield for valuation, Income Waterfall for the operating sibling, and Accruals Quality when reported NI and CFO diverge for several quarters. For capex-heavy cyclicals, pair with the Leverage card, capex booms often front-run debt builds.
FAQ
How do I know if a company's maintenance capex is reasonable?
Depreciation is the accounting estimate and usually approximates true maintenance capex for a steady-state business. If capex runs well above depreciation persistently, the excess is usually growth. Well below depreciation persistently suggests under-investing (the business is being harvested).
Should I subtract SBC to get "real" FCF?
For valuation purposes, I do. Most sell-side analysts don't consistently, which creates opportunities and traps depending on direction. For software businesses especially, SBC-adjusted FCF is closer to distributable cash.
What's a red flag for working capital manipulation?
Sustained large positive working capital contributions (especially receivables dropping faster than revenue growth would suggest, or payables stretching) over multiple quarters. Usually shows up in the Accruals Quality card before anywhere else.
How do I handle negative FCF for growth companies?
Use the waterfall to separate maintenance capex from growth capex. A company with positive operating cash flow that reinvests all of it into growth capex has "zero FCF" but isn't burning money in a problematic sense, it's choosing to deploy. A company with negative CFO is a different problem.
Is the card real-time or quarterly?
Quarterly. Cash flow statements are reported with the 10-Q and 10-K filings; the card updates on filing.
Related reading
- Accruals Quality, Earnings Manipulation
- Altman Z, Bankruptcy Risk
- Balance Sheet, Capital Structure
- EV/Revenue and EV/Sales Multiples
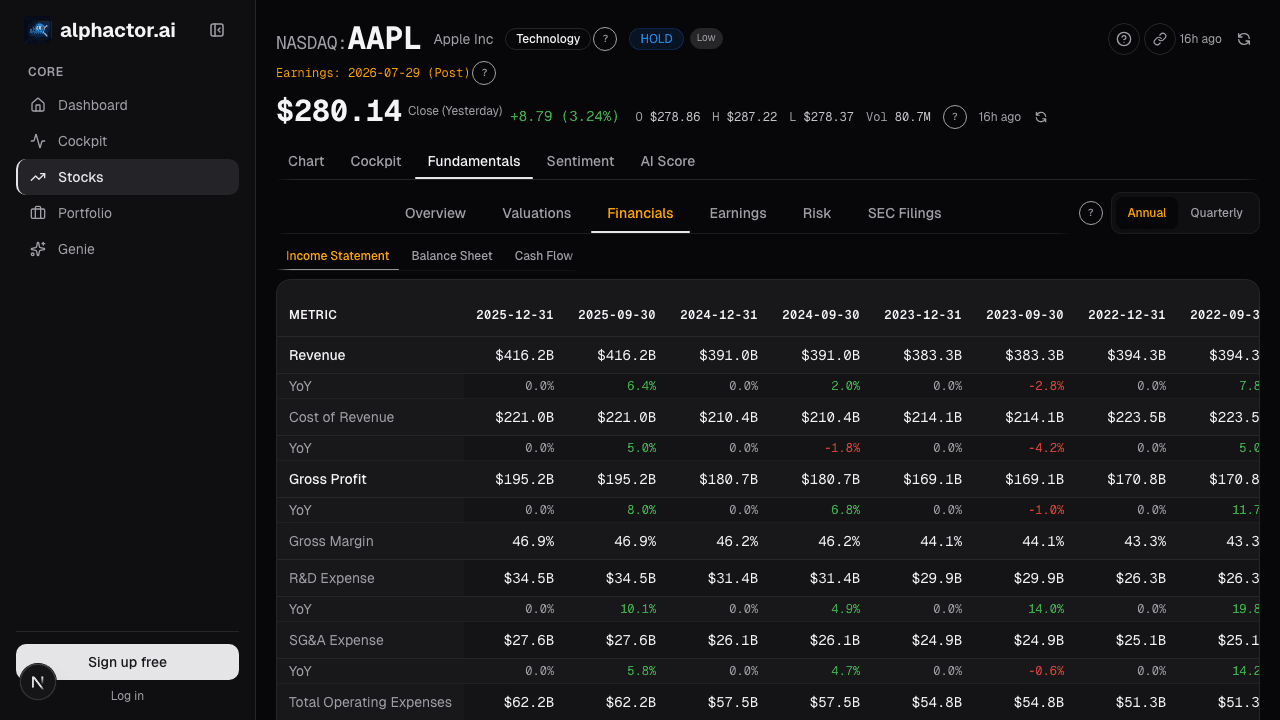
Open the Cashflow Waterfall → /app/stocks/AAPL/fundamentals
See it in the app
Live dashboard views that match this post. Each tile deep-links to the exact card.

Stocks mentioned
Related reading
Accruals Quality: How to Spot Earnings That Aren't Real
Accruals measure the gap between reported earnings and actual cash. Widening accruals is one of the most reliable red flags in financial analysis, Sloan's…
Altman Z-Score: A Bankruptcy Predictor That Still Works
Edward Altman's 1968 discriminant model predicts bankruptcy within two years about 72% of the time at its distress threshold.
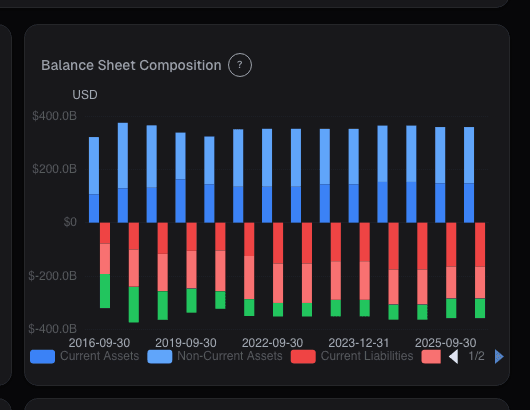
Balance Sheet Deep Dive
Balance sheet changes lead income statements by 2-6 quarters. Net debt, receivables days, and goodwill are the lines that move stocks first.
Debt-to-Equity Ratio
How to evaluate a company's debt load, when leverage creates value, when it destroys it, and the sector-specific thresholds that matter.
The Dividend Yield Trap: When High Yield Signals Danger
Why chasing the highest dividend yields is one of the most common mistakes income investors make, and how to identify sustainable dividends.
EV/Revenue: The Multiple That Survives When Earnings Don't
EV/Revenue survives where P/E breaks, but needs a growth bridge. Pre-profit software mid-cycle runs 0.2-0.4x growth-adjusted, how to avoid the reading traps.
Ready to try alphactor.ai?
Validate your trading strategies with statistical credibility testing. Start free.
Get Started Free