Fundamental analysis is the discipline of valuing a company by what it produces, owns, and owes, not by what its stock price did yesterday. People assume fundamentals are about exhaustive DCF models with twelve tabs of assumptions. They aren't. Good fundamental work is closer to forensic accounting with a side order of business judgment. You are looking for places where the reported numbers don't describe the business, and you are asking whether today's price pays you enough to own tomorrow's earnings.
I read a lot of 10-Ks and 10-Qs. After about two hundred of them, the skill stops being about "running the numbers" and starts being about knowing which three pages matter on which company. This pillar is the set of rules I wish someone had handed me the first time I opened an annual report.
The four questions every fundamental analysis answers
Before I open any filing or multiple, I write down four questions in the margin of my notebook:
- What does this business sell, and to whom? If I can't describe the business in two sentences without using their marketing copy, I don't know the company.
- How does the cash actually flow? Revenues are accounting; cash is real. Where does the money come from, and where does it go?
- What could permanently impair this business? Technology shifts, regulation, a single customer concentration, a balance-sheet accident. What is the downside case, and how likely is it?
- What am I being asked to pay for future earnings, and is that fair?
Everything else, P/E ratios, EV/EBITDA, DCF models, comps, is a tool for answering one of those four. If you lose sight of the question the tool is in service of, you end up with a beautiful spreadsheet that tells you nothing.
Reading a 10-K in under an hour
New readers try to read a 10-K front to back and burn out on page 30. That is not how the filings are written and not how professionals read them. The order matters:
- Item 1: Business. Fifteen minutes. This is the only place where management writes in narrative about what they actually do. Underline the revenue segments, the customer concentration disclosures, and any discussion of "strategic alternatives."
- Item 1A: Risk Factors. Skim. Most are boilerplate. Look for risk factors that changed vs. last year, those are the ones the lawyers thought were material enough to disclose. Diff against last year's 10-K if you can.
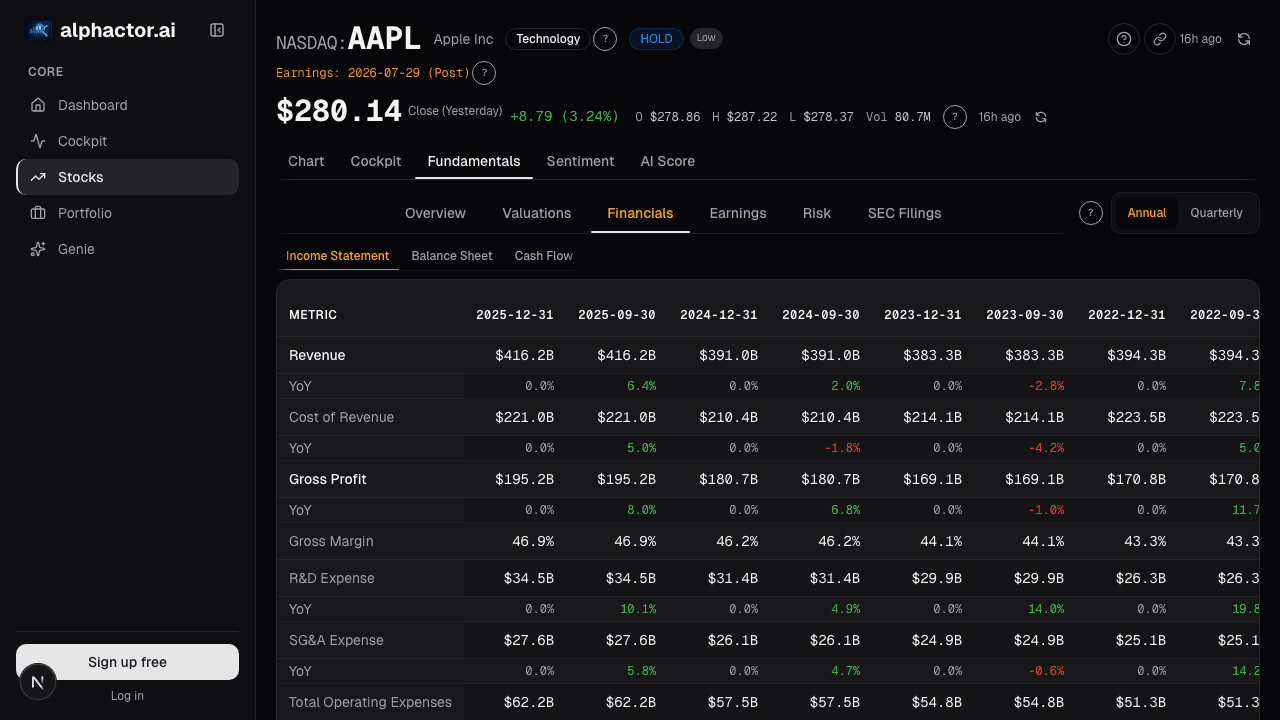
- Item 7: MD&A (Management Discussion and Analysis). Fifteen minutes. Read the YoY commentary on revenue, gross margin, and operating expenses. Note any explanations that feel hand-wavy, "macroeconomic headwinds" is often code for "we don't want to say what actually happened."
- Financial Statements. Fifteen minutes if you're quick. Start with the cash flow statement, not the income statement. I'll explain why in a moment.
- Footnotes. The rest of the hour. This is where the real disclosures live, segment detail, revenue recognition policies, off-balance-sheet commitments, related-party transactions, stock-based comp accounting.
If you only have thirty minutes, read Item 1, the cash flow statement, and the footnotes on revenue recognition and stock-based compensation. That covers ~80% of the cases where fundamentals diverge from the tape.
Cash flow statement first, always
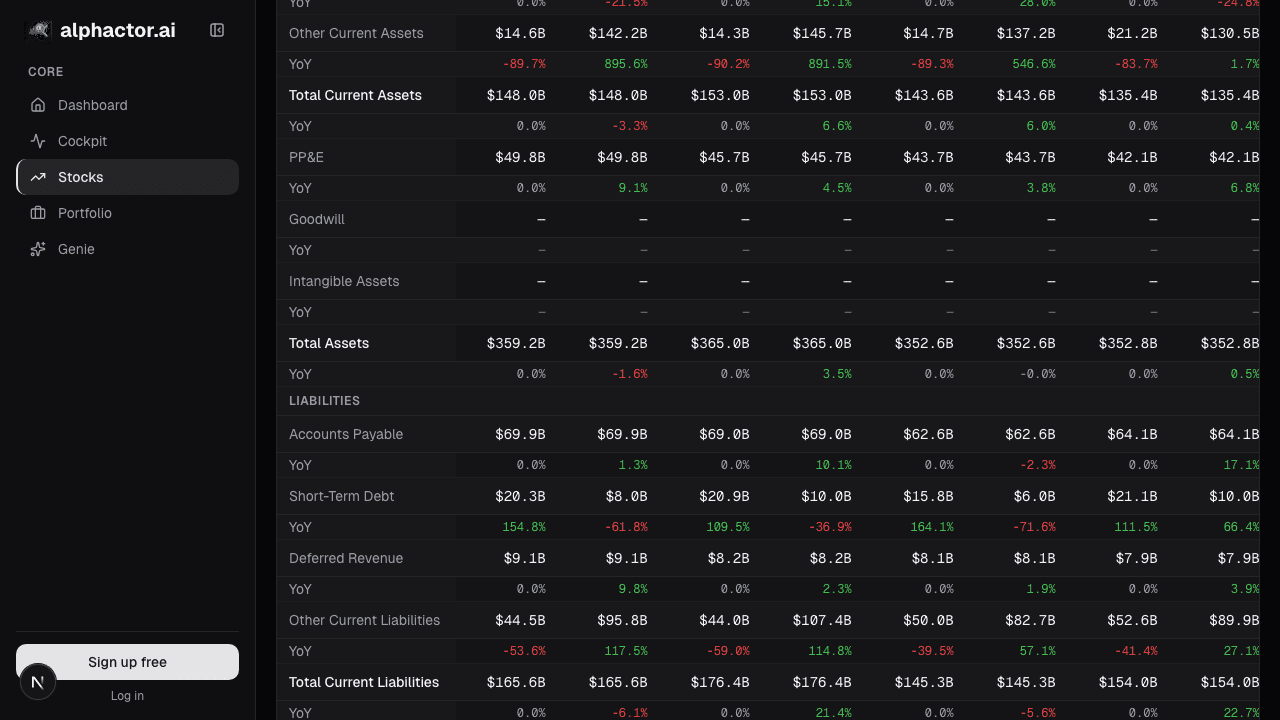
The income statement is the statement easiest to manipulate within GAAP. Revenue recognition policies, capitalized costs, non-cash stock comp, impairments, and a dozen other levers let management paint a picture of earnings that isn't backed by cash. The balance sheet is harder to manipulate but still reflects accounting choices. The cash flow statement is the hardest to fake because at the end you have to reconcile to actual cash in the bank.
My standard reading path on the cash flow statement:
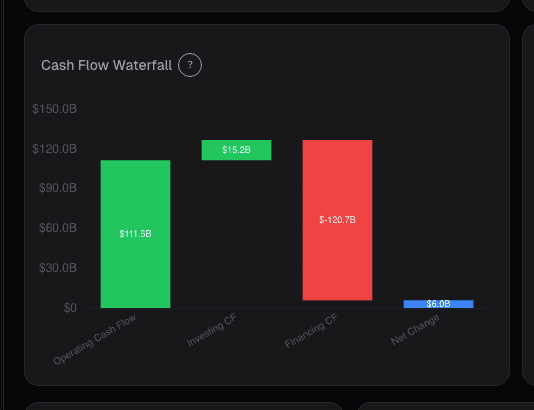
- Operating cash flow. Compare to net income. If operating cash flow is consistently below net income by >20%, accruals are piling up somewhere, receivables, inventory, or deferred revenue. That is the Sloan anomaly in miniature, and it is one of the best-documented earnings-quality signals.
- Capex vs. depreciation. If capex is persistently below depreciation, the business is harvesting its asset base. If capex is 3× depreciation during a growth phase, make sure the incremental capex is earning a return.
- Stock-based comp. Add it back to free cash flow to get a number that reflects what cash is actually being returned to shareholders vs. being re-issued as equity. A lot of tech companies look cash-generative until you account for SBC dilution.
- Acquisitions. Cash spent on M&A is not free cash flow even if it shows up below the FCF line. A company that grows only by acquisition has a different valuation profile than one that grows organically.
Multiples that are actually informative
Not all multiples are created equal. A short ranking of how much information is in each:
| Multiple | What it tells you | When it's useless |
|---|---|---|
| P/E (trailing) | Backward-looking earnings yield | Any business with cyclical or non-cash earnings |
| P/E (forward) | Analyst consensus on next year | When analysts are 6 months behind the business |
| EV/EBITDA | Capital-structure-neutral earnings yield | Any business with big working-capital swings |
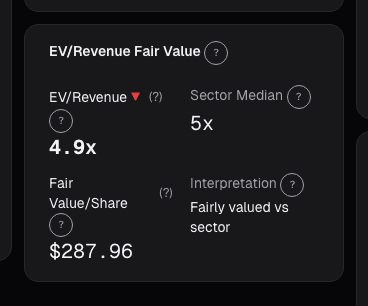
| EV/Sales | Cleanest top-line valuation | Useless without margin context |
| Price/Book | Reliable only for asset-heavy financials | Asset-light businesses |
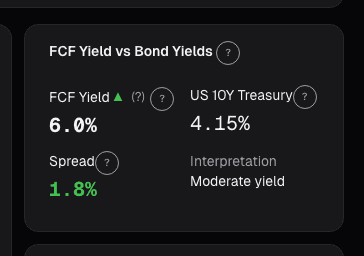
| Free Cash Flow Yield | Almost always the most honest | Early-stage or capex-heavy years |
| PEG | Growth-adjusted earnings yield | When growth estimates are fantasy |
The short version: free cash flow yield and EV/EBITDA are the two I anchor on, and I cross-check with forward P/E if analyst coverage is deep enough to trust. Anything else is secondary. The EV/Revenue Sales Multiple post goes deeper on when EV/Sales is appropriate and when it's a fig leaf.
The red-flag checklist
Over time I've built a list of accounting and disclosure patterns that deserve a pause. None of them is proof of anything; each of them has raised my skepticism enough times to be worth the minute it costs to check.
- Stock-based comp > 10% of revenue. Common in software; still worth understanding. If SBC is growing faster than revenue, dilution is eating your return.
- DSO (days sales outstanding) trending up faster than revenue. Either the customer base is deteriorating or revenue is being pulled forward.
- Inventory growing faster than revenue in consumer or industrial businesses. Classic demand softening signal; often precedes a gross-margin hit.
- Gross margin expansion without a unit-economics story. If gross margin jumped 500 bps and the company can't tell you exactly why, it's often a revenue-mix quirk that will reverse.
- Frequent changes in accounting policies. A revision to revenue-recognition or capitalization rules within a year before an IPO or follow-on is a yellow flag.
- Non-GAAP adjustments that grow faster than GAAP earnings. The delta between GAAP and non-GAAP is the management team's creative license. When it expands, they are selectively excluding more.
- Customer concentration above 20%. Single-point-of-failure revenue. If that customer leaves or negotiates a price cut, the whole investment thesis changes.
- Going-concern language in audit opinions. Read the auditor's letter. It is one page. If it contains the phrase "substantial doubt," stop everything else.
Example: reading NVDA's FY2025 filing
When I went through NVDA's FY2025 10-K I spent most of my time on two things: the segment breakdown (Data Center vs. Gaming vs. Auto) and the customer concentration disclosure. Data Center was ~78% of revenue, which is a concentration of its own, and the four largest customers were disclosed (in aggregate) at ~40%+ of revenue. That is not a red flag, it's an unusually concentrated customer base but the customers are strategic hyperscalers with multi-year capex commitments. The thesis you're making on NVDA isn't "diversified semiconductor business"; it's "strategic supplier to ~6 hyperscalers for as long as AI capex lasts." That's a legitimate thesis, but it's a different thesis from the one implied by the stock's multiple if you compared it naively to a generic semis peer set. This is the kind of thing the filings tell you and the screen doesn't.
Common mistakes
- Anchoring on trailing P/E for cyclical businesses. A cement or auto company at a 5× trailing P/E is often at peak earnings and about to mean-revert. Low multiples on cyclicals are traps more often than they're gifts.
- Taking management's "adjusted" numbers at face value. Adjusted EBITDA is a valuable lens, but you still have to reconcile it to GAAP and understand what's being excluded.
- Ignoring the dilution impact of SBC and convertible debt. A "cheap" stock on EPS basis can get substantially less cheap when you account for fully diluted share count after convert conversion or SBC vesting.
- Using DCF models with too many variable inputs. A DCF with five independent growth-rate variables is a number generator with a spurious decimal place. Fewer assumptions, more sensitivity analysis.
- Comparing multiples across industries. EV/EBITDA for a software company and a railroad are not the same ratio. Different capital intensity, different working capital, different reinvestment needs.
FAQ
Should I build DCF models for everything I buy?
No. Build DCF when the answer to "what's this worth" hinges on a specific growth-and-reinvestment story you want to pressure-test. For most public equities, a comps-and-FCF-yield approach is sufficient, and more honest because it surfaces fewer fake assumptions.
How much of my time should go into reading filings vs. reading the tape?
For positions I plan to hold longer than 3 months: 70/30 filings-to-tape. For shorter holds: the ratio flips. The tape tells you what is happening now; the filings tell you what is sustainable.
Are there shortcuts that work?
Free cash flow yield + customer concentration disclosure + stock-based comp footnote gets you 70% of the way on most companies. The remaining 30% is company-specific and there's no shortcut.
What's the single most important number?
Free cash flow per share, net of stock-based compensation, averaged over the last three to five years. Not a multiple, a dollar number. That is what owners get.
How do I tell if I'm overpaying?
Calculate what future growth rate in owner earnings the current multiple requires. If the market is paying for 20%+ FCF growth for the next decade and the business has never grown that fast, you're paying for a hope. If the required growth rate is 3% and the business grew 7% over the last decade, you have a margin of safety.