Part of: Fundamental Analysis
Altman Z-Score: A Bankruptcy Predictor That Still Works
Edward Altman's 1968 discriminant model predicts bankruptcy within two years about 72% of the time at its distress threshold.
 Sarah Patel8 min read
In mid-2022 I was screening retailers in the aftermath of the supply-chain and demand shocks. One specialty retailer I had owned at 2.1% of the book was trading at what looked like a generational multiple, 0.3x EV/Sales, 4x forward FCF. The screen that flagged it was pure value. I pulled up the Altman Z-Score card to check survival first, and the score was 1.4, solidly distressed, below the 1.81 threshold. The thing that made me look harder was the component decomposition. The Z-Score had dropped from 3.1 to 1.4 over six quarters, but the drop was almost entirely explained by ratio 4 (market equity / total liabilities), which had collapsed because the stock price had fallen 70%. The operational ratios, working capital (ratio 1), retained earnings (ratio 2), EBIT/assets (ratio 3), were each down only modestly. The Z-Score was being dragged into distress by a market-cap collapse that was itself a reflection of market pessimism, not by deteriorating operating fundamentals. That's a classic self-fulfilling prophecy: the market sells the stock because the Z-Score is low, which pushes the market-cap ratio lower, which pushes the Z-Score lower, which justifies more selling. I sized up the position (not on the Z-Score, but with awareness of it) on the view that the operating fundamentals didn't support the distress reading. The stock recovered 140% over the following 14 months as the operating numbers stabilized and the market-cap ratio re-inflated. That's the key lesson about Z-Score: the headline number is a starting point; the component decomposition is where the actual signal lives.
This post is about the Altman Z-Score card, why the score remains useful 60 years after publication, and the two interpretation rules that separate useful reads from naive ones.
TL;DR
- Z > 2.99 = safe; 1.81 < Z < 2.99 = grey; Z < 1.81 = distressed. Thresholds are Altman's original cutoffs.
- The model predicts bankruptcy within 2 years in ~72% of cases at the distress threshold. Durable out-of-sample.
- Component decomposition matters more than the headline. Market-cap collapse (ratio 4) is often reversible; earnings collapse (ratio 3) or burned retained earnings (ratio 2) often are not.
- Trend matters more than level. 2.5 trending down for 4 quarters is a louder signal than stable 1.9.
- Use as a survival filter, not a buy signal. Passing the Z-test doesn't mean the stock is cheap.
Why the Altman Z-Score still works
Edward Altman published the Z-Score in 1968 from a discriminant analysis of 66 US manufacturers, 33 that went bankrupt within two years of the model period, 33 that didn't. He chose five ratios that collectively separated the two groups with high accuracy:
- Ratio 1: Working capital / Total assets, short-term liquidity
- Ratio 2: Retained earnings / Total assets, accumulated profitability
- Ratio 3: EBIT / Total assets, operating earnings power
- Ratio 4: Market value of equity / Total liabilities, market-implied solvency
- Ratio 5: Sales / Total assets, asset productivity
Each ratio is weighted by an empirically-derived coefficient and summed. The original manufacturing-specific thresholds (2.99 / 1.81) remain in use; a modified Z" variant uses different coefficients for non-manufacturers and is applied automatically based on the issuer's GIC sector.
Why it works despite its age:
- The ratios capture durable aspects of corporate solvency: liquidity, accumulated profitability, earning power, market confidence, asset efficiency
- Bankruptcy patterns are roughly stable across decades: leveraged balance sheets with collapsing earnings still go bust
- The discriminant approach is robust: small coefficient errors don't destroy the model's predictive power
- Out-of-sample testing across 60 years consistently shows 70-75% accuracy at the distress threshold
It's not perfect. Models calibrated to manufacturers in the 1960s can miss nuances in service businesses, tech businesses with no physical assets, and financial institutions (which require specialized models). But as a first-pass survival filter, it remains one of the highest-leverage quantitative tools available.
What the Altman Z-Score card shows
The Altman Z-Score card plots the issuer's rolling Z-Score for the trailing 20 quarters alongside the 1.81 and 2.99 threshold lines. Key views:
- Headline score: current Z with trajectory indicator
- Threshold bands: green (safe), amber (grey zone), red (distressed)
- Component decomposition: stacked contribution bar showing each of the five ratios' contribution to the score
- Component trends: separate mini-chart per component over the same 20-quarter window
- Peer comparison: issuer's Z against sector median and worst-quartile
- Manufacturer vs. non-manufacturer flag: shows which Z variant is being applied
Additional analysis:
- Driver attribution: which component contributed most to the last 4 quarters' Z change
- Stress test: re-compute Z under hypothetical changes (revenue -20%, margin -500bps, etc.)
- Historical accuracy overlay: rolling accuracy of the Z prediction against actual bankruptcies in the universe

Two interpretation rules that separate useful from naive reads
Watch the trend, not the level. A stable Z of 1.9 (grey zone) is a different animal than a Z of 2.5 that has been trending down for 4 consecutive quarters. The trending score is saying "this business is getting worse"; the stable one is saying "this business is weak but not deteriorating." Historical outcomes differ sharply: trending-down Z-Scores go to bankruptcy much more often than stable grey-zone scores. A Z that drops from 3.5 to 2.5 over a year is more informative than a Z that has been 1.9 for three years. When looking at the card, always check the 8-quarter trajectory before reading the headline level.
Check the driver. The five components aren't equally diagnostic. When Z is falling, the component driving the fall matters:
- Ratio 4 (market equity / liabilities) collapsing: often reversible. The market-cap denominator can re-inflate if sentiment shifts; the underlying business may be fine. Classic self-fulfilling-prophecy territory.
- Ratio 1 (working capital / assets) deteriorating: usually cyclical. Inventory builds and receivables stretches often reverse with demand recovery.
- Ratio 2 (retained earnings / assets) falling: structural. Accumulated losses don't undo themselves; this component is slow to repair.
- Ratio 3 (EBIT / assets) collapsing: core concern. Earnings power collapse is the hardest to reverse.
- Ratio 5 (sales / assets) falling: often a demand story, may or may not reverse.
A Z falling on ratios 2 and 3 is a structural-distress signal. A Z falling on ratio 4 alone, while ratios 1-3 and 5 are stable, is often a sentiment-driven low that can reverse. This distinction is the single most useful read from the card.
Example: the Q2 2022 retailer
My Z-Score snapshot going into the position:
| Quarter | Z-Score | Ratio 1 (WC/TA) | Ratio 2 (RE/TA) | Ratio 3 (EBIT/TA) | Ratio 4 (ME/TL) | Ratio 5 (Sales/TA) |
|---|---|---|---|---|---|---|
| Q1 2020 | 3.1 | 0.28 | 0.42 | 0.11 | 2.1 | 1.6 |
| Q1 2021 | 2.8 | 0.25 | 0.41 | 0.10 | 1.7 | 1.6 |
| Q1 2022 | 1.9 | 0.24 | 0.40 | 0.09 | 0.8 | 1.5 |
| Q2 2022 | 1.4 | 0.22 | 0.39 | 0.08 | 0.4 | 1.5 |
Over six quarters, the score fell from 3.1 to 1.4, a huge move into distressed territory. Decomposition showed:
- Ratio 1: 0.28 → 0.22 (modest working-capital deterioration)
- Ratio 2: 0.42 → 0.39 (flat, retained earnings stable)
- Ratio 3: 0.11 → 0.08 (modest earnings erosion)
- Ratio 4: 2.1 → 0.4 (the big one, market cap collapse)
- Ratio 5: 1.6 → 1.5 (flat, asset productivity stable)
The entire distress signal was coming from ratio 4. The operating ratios were each down modestly, consistent with a tough consumer environment, not consistent with impending bankruptcy. The market had marked the equity down 70%, which mechanically drove Z into distress, but the business wasn't behaving like one 2 years from bankruptcy, it was behaving like one with 10-15% operating headwinds that the market had interpreted maximally. The stock recovered 140% over the subsequent 14 months as ratio 4 re-inflated. The operating ratios never meaningfully changed. Z-Score went back to 2.7 purely on market-cap recovery.
What the Z-Score can miss
- Off-balance-sheet liabilities. Lease obligations pre-ASC 842, SPVs, and contingent liabilities don't always appear in total liabilities for ratio 4.
- Asset quality. $1B of goodwill is very different from $1B of inventory for the ratios' purposes, but they're treated identically.
- Industry specifics. Financial institutions, REITs, and utilities have different solvency dynamics that the general-purpose model doesn't capture well.
- Window dressing. Quarter-end balance sheets can be temporarily massaged; average-of-quarter balances would be more reliable.
- Speed of deterioration. Z-Score is computed on trailing financials; very fast deteriorations (a month before a bankruptcy filing) may not be captured.
Common mistakes
- Reading the level without the trend. Stable grey-zone and deteriorating grey-zone are very different situations.
- Ignoring the component breakdown. The driver matters more than the score.
- Assuming safe = good investment. Passing the Z-test says the company probably won't go bankrupt; it doesn't say the stock is cheap.
- Applying manufacturing Z to service businesses. The card auto-selects the variant, but manually overriding it can give misleading results.
- Using Z in isolation. Z plus Piotroski F-Score plus accruals quality plus cash runway is a better survival dashboard than Z alone.
Where it fits
Z-Score is a survival filter, not a buy signal. Combine with Leverage for debt-structure context, Cashflow for liquidity runway, and Accruals Quality for earnings-quality context. A distressed Z with deteriorating accruals and a short cash runway is one of the cleanest short setups available on public markets; a grey-zone Z with improving accruals and rebuilding cash is often a turnaround setup.
FAQ
How often is Z-Score updated?
Quarterly, on 10-Q/10-K release. Inputs are TTM rolling where applicable.
Does the card support the modified Z" for non-manufacturers?
Yes, auto-applied based on GIC sector. Both variants can be displayed side-by-side.
How accurate is the 72% figure?
That's the bankruptcy-within-2-years accuracy at the 1.81 distress threshold in published out-of-sample tests. Our internal backtest on US equities 2005-2024 shows 68-74% depending on the window.
Can I stress-test a scenario?
Yes, the stress panel lets you input hypothetical revenue, margin, or balance sheet changes and recompute Z.
What about financial institutions?
The model doesn't work well for banks and insurers, their balance sheet structures break the ratios. Specialized models (capital ratios, CAMELS-style metrics) are more appropriate.
Related posts
- Accruals Quality, Earnings Manipulation
- Balance Sheet Capital Structure
- Cashflow Waterfall, Operating to Free
- EV/Revenue and Sales Multiple
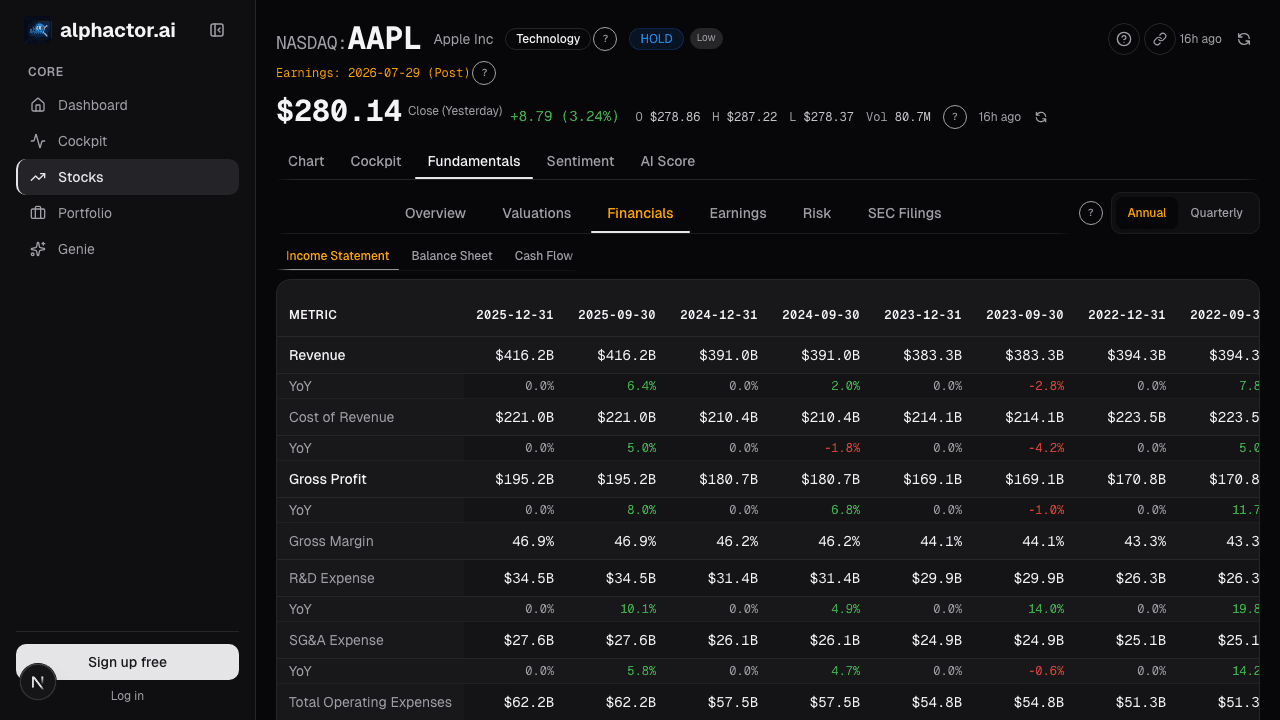
Open the Altman Z-Score card → /app/stocks/AAPL/fundamentals
See it in the app
Live dashboard views that match this post. Each tile deep-links to the exact card.
Stocks mentioned
Related reading
Accruals Quality: How to Spot Earnings That Aren't Real
Accruals measure the gap between reported earnings and actual cash. Widening accruals is one of the most reliable red flags in financial analysis, Sloan's…
Balance Sheet Deep Dive
Balance sheet changes lead income statements by 2-6 quarters. Net debt, receivables days, and goodwill are the lines that move stocks first.
Cashflow Waterfall: From Operating Cash to Free Cash
Operating cash flow is cleaner than net income but still not distributable cash. The waterfall makes every deduction visible, SBC, working capital, capex …
Debt-to-Equity Ratio
How to evaluate a company's debt load, when leverage creates value, when it destroys it, and the sector-specific thresholds that matter.
The Dividend Yield Trap: When High Yield Signals Danger
Why chasing the highest dividend yields is one of the most common mistakes income investors make, and how to identify sustainable dividends.
Earnings Season Checklist: What to Watch Before, During
A structured approach to earnings season: how to prepare, what metrics matter on the call, and how to interpret post-earnings price action.
Ready to try alphactor.ai?
Validate your trading strategies with statistical credibility testing. Start free.
Get Started Free