Blog /
#fundamentals
32 posts tagged fundamentals.
32 posts

Accruals Quality: How to Spot Earnings That Aren't Real
Accruals measure the gap between reported earnings and actual cash. Widening accruals is one of the most reliable red flags in financial analysis, Sloan's…
Altman Z-Score: A Bankruptcy Predictor That Still Works
Edward Altman's 1968 discriminant model predicts bankruptcy within two years about 72% of the time at its distress threshold.
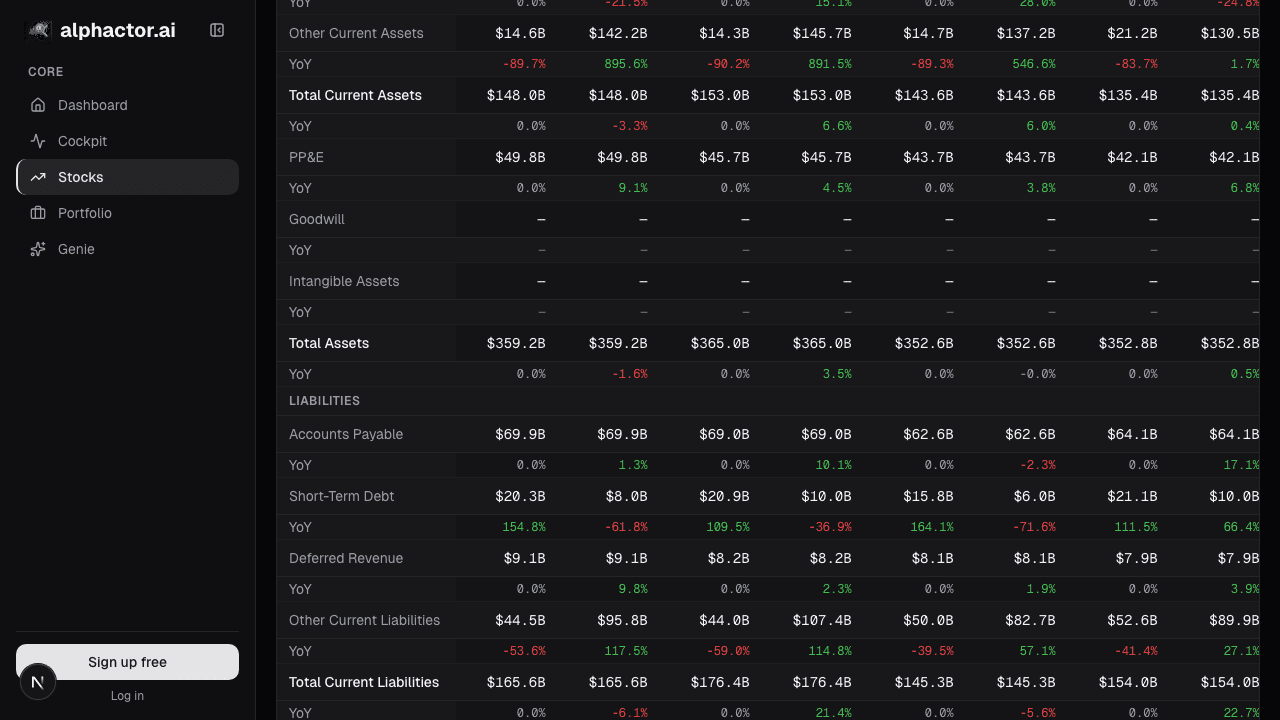
Balance Sheet Deep Dive
Balance sheet changes lead income statements by 2-6 quarters. Net debt, receivables days, and goodwill are the lines that move stocks first.
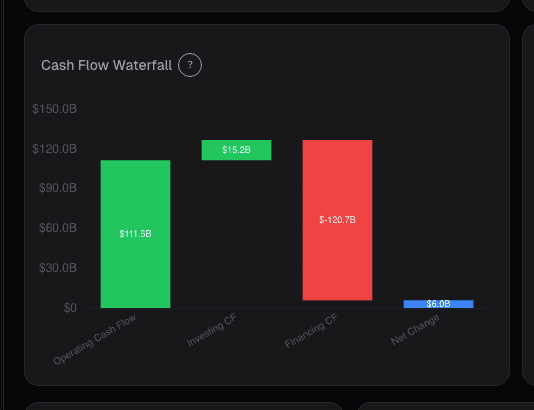
Cashflow Waterfall: From Operating Cash to Free Cash
Operating cash flow is cleaner than net income but still not distributable cash. The waterfall makes every deduction visible, SBC, working capital, capex …
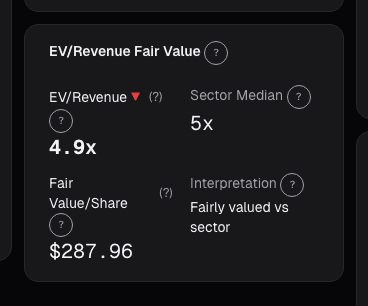
EV/Revenue: The Multiple That Survives When Earnings Don't
EV/Revenue survives where P/E breaks, but needs a growth bridge. Pre-profit software mid-cycle runs 0.2-0.4x growth-adjusted, how to avoid the reading traps.
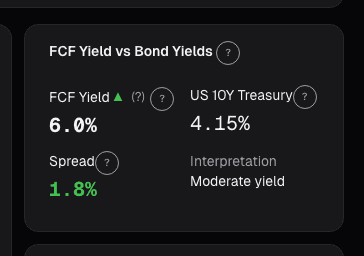
FCF Yield: What You're Actually Earning Today
FCF yield answers the most basic question in equity investing: if I buy this company today, how much cash does it throw off per dollar?
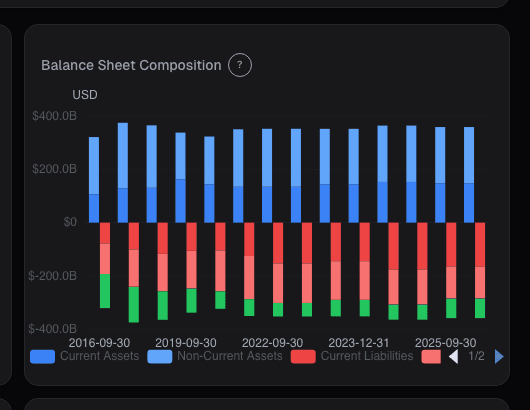
Balance Sheet Chart: Assets, Debt, and Equity Over Time
A single quarter's balance sheet hides the trajectory. A company can look fine today while quietly levering up 3 turns over 5 years, or sitting on a growing…
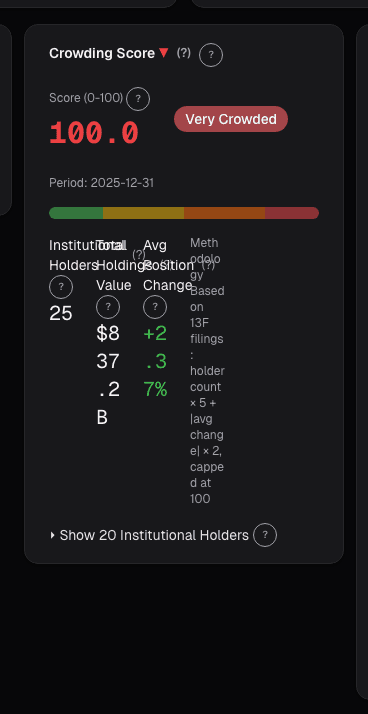
Crowding: When Too Many Funds Hold the Same Bet
A consensus long can become a forced unwind in a week. The Crowding card measures fund-ownership overlap, short interest, and factor exposure so you can see…
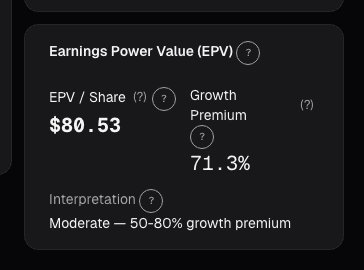
Earnings Power Value
EPV asks what a company is worth assuming zero growth, forever. The gap between EPV and market cap is the growth premium.

SEC Filings: Reading the Primary Source Directly
Every third-party analysis loses information. Diffing new SEC risk factors vs. the prior year filing is the highest-leverage research activity for any investor.
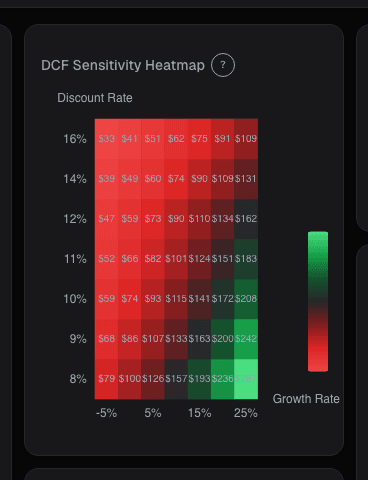
Valuation Sensitivity
A DCF prints one number; the truth is a distribution. Swinging WACC by 100 bps and terminal growth by 50 bps routinely moves the output by 40-70%.
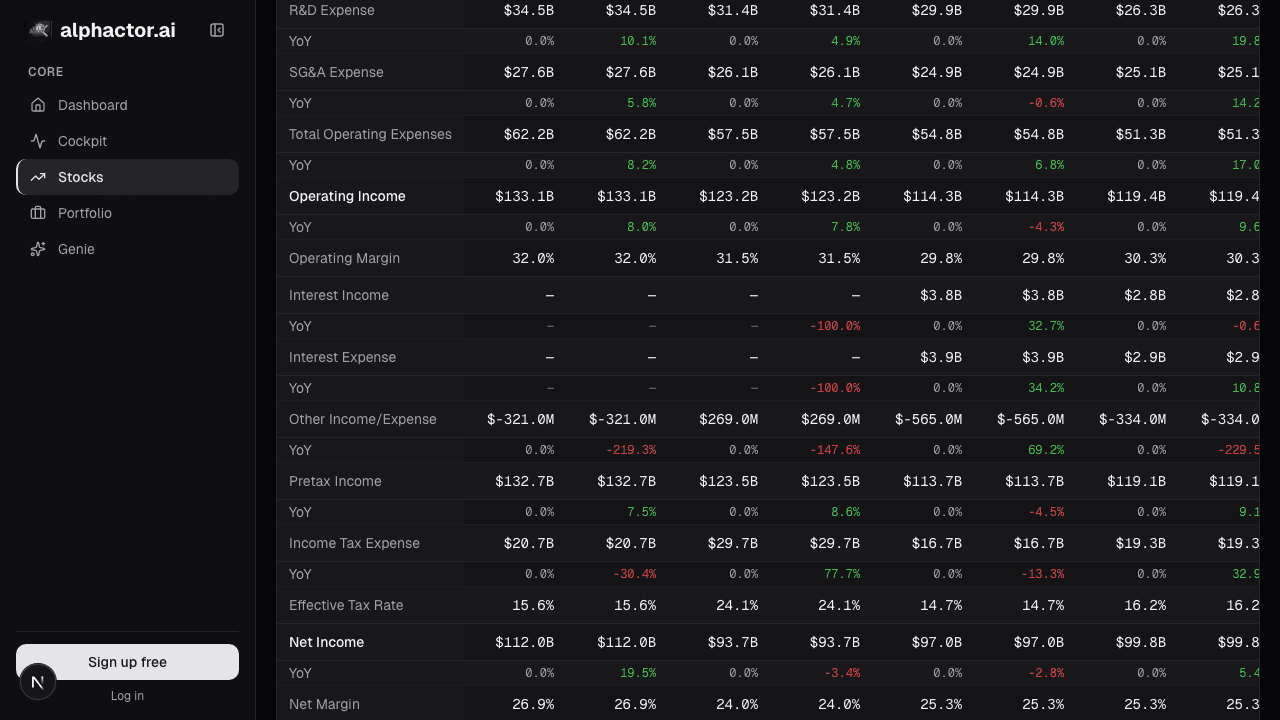
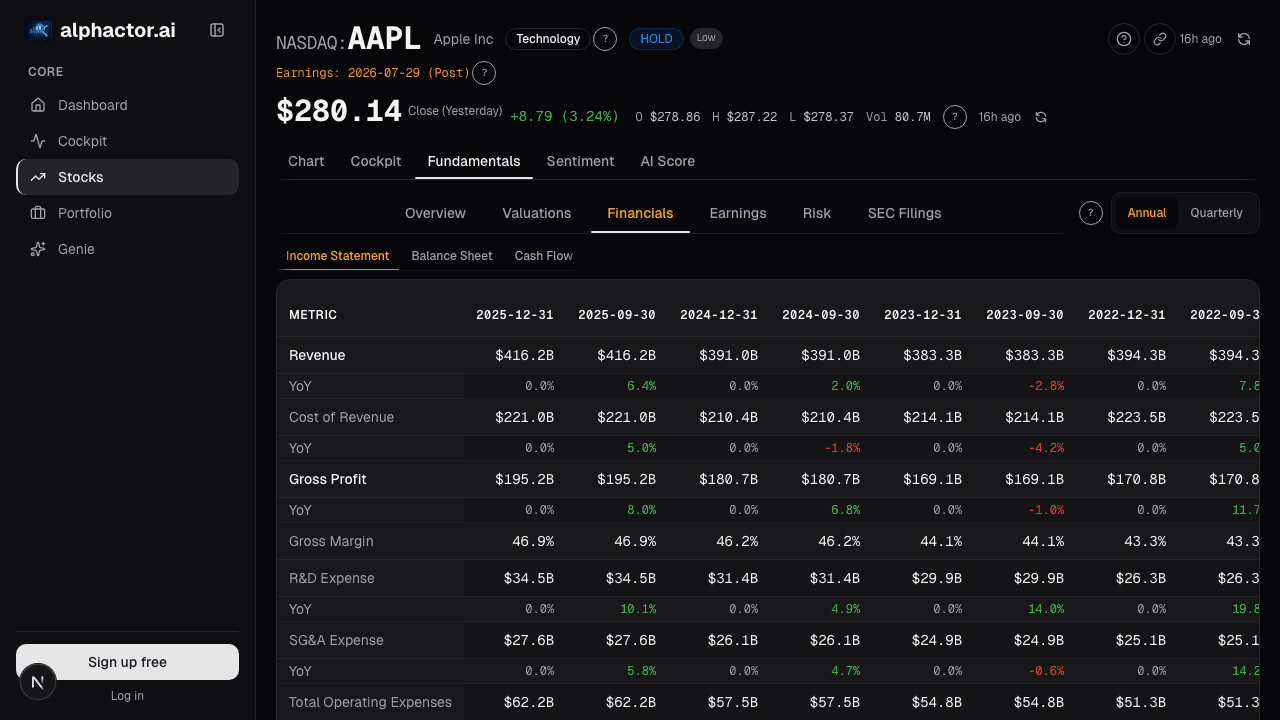
Income Statement Deep Dive
Press releases report two numbers. The full P&L is where you find restructuring charges pushed below the line, segment reclassifications that change…