Part of: Fundamental Analysis
Crowding: When Too Many Funds Hold the Same Bet
A consensus long can become a forced unwind in a week. The Crowding card measures fund-ownership overlap, short interest, and factor exposure so you can see…
 Sarah Patel7 min read
In August 2021 a set of consensus long hedge-fund names dropped 15–25% over a two-week window without any fundamental news. The trigger was a multi-strategy fund with known leverage problems de-grossing to meet a risk-limit breach, not company-specific anything. The names that fell hardest weren't the ones with worst fundamentals; they were the ones where too many funds with overlapping strategies held the same position. I had one of them in a portfolio I was managing. I watched it drop 18% on nothing, decided the thesis was intact, held, and got the rebound. But if I'd been forced to mark-to-market for a funding event that week, the position's 13F-concentration profile would have cost me. The fundamental thesis didn't change during the drawdown; the market's forced seller did. That kind of risk doesn't show up in P/E or revenue growth, it shows up in who owns the stock, and how much they have to sell if they need to.
This post is about the Crowding card, why consensus ownership is a real risk factor, and the four measures that together estimate forced-seller exposure.
TL;DR
- Crowded positions have higher idiosyncratic drawdown tail risk. Academic literature documents this cleanly; the drawdowns cluster around deleveraging events, not fundamentals.
- Four measures combine into a crowding view: 13F overlap, short interest, factor exposure, retail sentiment. No single measure is sufficient.
- Crowding doesn't time the unwind. It tells you where the unwind will hurt most when it happens.
- Size smaller when crowding > 80 AND momentum > 80. Classic crowded-momentum trap.
- Short-interest > 15% with days-to-cover > 5 is a real squeeze candidate. Relevant for earnings setups and known event risk.
Why crowding risk is real risk
Crowding is the risk that a forced seller pattern, a fund hitting a risk limit, a multi-manager degrossing, an ETF rebalance, produces correlated selling in names that many funds hold simultaneously, regardless of company fundamentals. The GMO and AQR literature documents this pattern cleanly: crowded names have higher idiosyncratic drawdown tail risk, and the drawdowns cluster around deleveraging events rather than earnings or macro news. A "12-sigma" move in a name with no news is almost always a crowded-unwind signature.
Crowding doesn't time the unwind. It tells you *where* the unwind is going to hurt most when it happens. That's still useful. A portfolio with crowding-adjusted sizing, trimming the most crowded names, holding stable through the rest, will have a smoother volatility profile through deleveraging events even if it has similar expected return. For anyone running fund-like capital or leveraged positions, the measure matters enormously. For long-term buy-and-hold, it matters less, a 20% drawdown on nothing is painful, but if the thesis is intact the drawdown reverses.
What the Crowding card shows
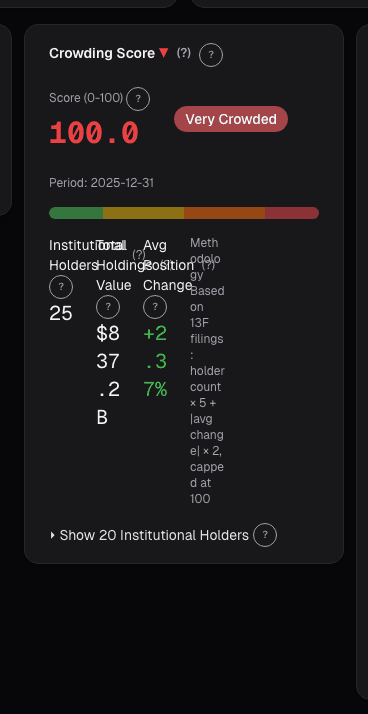
The Crowding card aggregates four measures:
- 13F ownership overlap: share of the top 100 13F funds long the name, plus a Herfindahl concentration index across the holders. The combination flags names that are widely held *and* held in size by a small number of big holders.
- Short interest: percent of float short, days-to-cover calculated against 30-day average volume, and 6-month trend (rising / falling short interest).
- Factor crowding: decomposition of total fund ownership into exposure to known crowded factors: low-vol long, momentum long, growth long, quality long. A name that scores high on all four factor-exposure metrics simultaneously is especially crowded.
- Retail crowding proxy: WSB mention percentile and Google Trends search-interest percentile. Retail crowding is a different regime from fund crowding; both matter but they produce different unwind dynamics.
A composite crowding score normalized 0–100 summarizes the whole picture, with drill-down into each component.
Reading the score for position sizing
Crowding > 80 combined with momentum > 80 is the classic crowded-momentum setup. The positive expected return on momentum factor is real, but the left-tail risk in crowded names is much worse than a standard volatility-targeted sizing would assume. A reasonable adjustment: reduce position size 20–30% below what a vol-target suggests. You give up some expected return, buy tail protection against deleveraging drawdowns. The tradeoff is worth it for most risk-adjusted investors.
Short interest > 15% of float with days-to-cover > 5 is a real squeeze candidate. This isn't directly bullish, squeezes require a catalyst, usually an earnings beat or positive news. But if you're holding such a name into a known event window, the squeeze asymmetry is meaningful. Conversely, if you're short such a name, you have quantified squeeze risk, many managers won't short a name with these metrics regardless of thesis.
Rising short interest with falling price is different from rising short interest with rising price. The first often confirms a bearish thesis is being picked up by more market participants. The second is a crowded short that's grinding against its sellers, setup for a squeeze if anything changes. The 6-month trend line in the card shows the trajectory.
Example: sizing around a crowded name
Mid-2024 I held a software name that screened beautifully on fundamentals, Rule of 40 passing, growth-adjusted EV/Sales at the 30th percentile of peers, FCF margin expanding. My initial vol-target sizing was 5% of book. Then I looked at the Crowding card:
- 13F overlap: 78% of top 100 funds long (high)
- Herfindahl: top 5 holders owned 22% of float (very concentrated)
- Factor crowding: high growth + high quality + moderate momentum
- Composite score: 84
At 5% sizing the volatility math was fine. The crowding math wasn't. I cut the position to 3% and added a 2% position in a less-crowded peer with a slightly worse fundamental profile. Four months later a multi-strategy derisking event hit the growth-quality factor complex; my crowded name dropped 14% in a week on no news, the less-crowded peer dropped 6%. Net effect: I lost less than the 5% sizing would have cost, and the fundamental thesis played out eventually (both names are higher today). The crowding discipline earned its keep in a specific window where sizing mattered.
What the card won't fix
- It doesn't predict when deleveraging happens. Multi-strategy risk events are impossible to time; the card just tells you where the damage concentrates when they occur.
- The 13F data is stale. Filings are quarterly with a 45-day delay, so the ownership picture is always 1–5 months behind. Fine for structural crowding; bad for tactical positioning around a specific event.
- Retail crowding dynamics differ from fund crowding. A WSB-driven squeeze has different mechanics (gamma squeezes, concentrated short covering) than a multi-strategy degrossing. The card measures both but doesn't fully model the different unwind pathways.
- Short-interest data lags. FINRA short-interest reports are twice-monthly with a settlement lag, so the reported value is typically 2–3 weeks behind current. The trend is usually more informative than the point value.
Common mistakes
- Using crowding as a trade signal by itself. It isn't one. It's a risk-sizing input. Crowded names can remain crowded and outperform for extended periods; the risk is tail, not mean.
- Ignoring crowding because "I'm long-term." Even long-term holders care about drawdown if they're levered or face liquidity calls. For unlevered long-term capital, crowding matters less.
- Treating all crowding sources as equivalent. Fund crowding and retail crowding produce different unwind dynamics; don't pool them into one number without looking at the breakdown.
- Overreacting to one high score. Many profitable, durable, widely-held names score high on crowding (AAPL, MSFT, NVDA at various times). High crowding alone is not a sell signal.
- Assuming a short-interest squeeze is imminent. Squeezes require catalysts. A 20% short-interest name can stay at 20% short interest for years if the bearish thesis remains plausible.
Where it fits
Pair crowding with Institutional Holders for the 13F details (which funds specifically, position sizes, quarter-on-quarter changes), Factor Analysis for the factor-exposure decomposition, and the Portfolio Stress Test for scenario modeling of a crowded-unwind event across your whole book.
FAQ
How often does the crowding score update?
13F components update quarterly on filing deadlines. Short-interest components update twice-monthly. Factor crowding updates monthly with the factor-model refit. Retail proxies update daily.
Can I use this for shorts?
Yes, high crowding on the short side (many funds short the same name) is a squeeze candidate, and the card flags it. The asymmetric risk for shorts in crowded shorts is the mirror of long-side deleveraging risk for crowded longs.
Is crowding a sell signal?
No. It's a position-sizing input. A name can be crowded and continue to outperform; the question is how sizing should respond to the concentration tail risk.
What's the academic basis?
Ang and Chen on idiosyncratic volatility, GMO notes on quality/momentum crowding, AQR on factor crowding. The consistent finding is elevated drawdown tail risk in crowded positions during deleveraging events.
How does this apply to ETFs?
The crowding framework is designed for individual names. For ETFs, the analog is concentration in underlying holdings plus ETF-flow dynamics. The ETF Holdings Concentration card handles that case.
Related reading
- Accruals Quality, Earnings Manipulation
- Altman Z, Bankruptcy Risk
- Balance Sheet, Capital Structure
- Cashflow Waterfall
Open the Crowding card → /app/stocks/AAPL/fundamentals
See it in the app
Live dashboard views that match this post. Each tile deep-links to the exact card.

Stocks mentioned
Related reading
Accruals Quality: How to Spot Earnings That Aren't Real
Accruals measure the gap between reported earnings and actual cash. Widening accruals is one of the most reliable red flags in financial analysis, Sloan's…
Altman Z-Score: A Bankruptcy Predictor That Still Works
Edward Altman's 1968 discriminant model predicts bankruptcy within two years about 72% of the time at its distress threshold.
Balance Sheet Deep Dive
Balance sheet changes lead income statements by 2-6 quarters. Net debt, receivables days, and goodwill are the lines that move stocks first.
Price-to-Book Value: Useful for Banks, Misleading for Tech
Price-to-book works for banks and asset-heavy industrials but misleads for software. Here is how to apply it correctly by sector and when to skip it.
Cashflow Waterfall: From Operating Cash to Free Cash
Operating cash flow is cleaner than net income but still not distributable cash. The waterfall makes every deduction visible, SBC, working capital, capex …
Ready to try alphactor.ai?
Validate your trading strategies with statistical credibility testing. Start free.
Get Started Free