Part of: Fundamental Analysis
Accruals Quality: How to Spot Earnings That Aren't Real
Accruals measure the gap between reported earnings and actual cash. Widening accruals is one of the most reliable red flags in financial analysis, Sloan's…
 Sarah Patel7 min read
Three weeks before a well-known apparel retailer blew up in 2014, every major sell-side shop had a buy rating and an earnings-beat-driven price target raise. I'd been skeptical for a year, not because of the income statement (which was fine) but because of the working-capital build. Inventory days had expanded from 85 to 108 over six quarters. Days sales outstanding had crept from 42 to 61. Net income was compounding 9% a year; cash flow from operations had been approximately flat for two years. The accruals measure (NI - CFO / avg total assets) had ballooned to the top decile of the sector. When the company pre-announced a "one-time" $400M inventory markdown and issued weaker-than-expected guidance, the stock gapped down 32%. Nothing about the announcement was a surprise if you'd been reading the accruals. The "beat" had been the accrual pulling earnings forward while cash didn't follow.
This post is about the Accruals Quality card, the Sloan paper it implements, and the two patterns that separate benign cyclical accruals from the kind that end badly.
TL;DR
- Accruals are the gap between reported earnings and actual cash. Widening accruals = earnings running ahead of cash.
- Sloan (1996) showed high-accrual names underperform low-accrual by ~10%/year. Persistent finding across decades.
- Receivables days growing faster than revenue is channel-stuffing. Inventory days exploding is the glut pattern.
- Cyclical accruals are normal. Persistent multi-quarter accrual expansion without cash-flow improvement is not.
- Read accruals in context of F-Score and Z-Score. Three lenses on quality.
Why accruals matter
Every income statement is an accrual construction, it records revenues and expenses when *earned* or *incurred*, not when *paid*. That flexibility is useful (matches effort with result) but it's also where earnings manipulation lives. Accruals are the difference between net income and cash flow from operations, scaled by total assets:
Accruals = (Net Income - Cash Flow from Operations) / Average Total AssetsWhen accruals widen sharply, earnings are "ahead of" cash. That can mean any of three things: inventory is swelling (the company produced more than it sold), receivables aren't being collected (customers owe more than they're paying), or aggressive revenue recognition is pulling future sales into the current period. All three are common. All three end badly when the pattern persists.
Richard Sloan's 1996 paper ("Do Stock Prices Fully Reflect Information in Accruals and Cash Flows About Future Earnings?") showed that high-accrual companies underperform low-accrual companies by roughly 10% per year on average, and the effect has persisted in out-of-sample testing for decades since. The market under-prices the quality difference between cash earnings and accrual earnings. Reading accruals is one of the cleanest available edges.
What the Accruals Quality card shows
The Accruals Quality card plots:
- Rolling Sloan accruals measure: (NI − CFO) / Avg Total Assets, over 20 quarters
- Decomposition into major drivers: receivables, inventory, payables, deferred revenue, other, so you can see which line is driving the aggregate
- Receivables days, inventory days, payables days: the underlying working-capital metrics
- Sector percentile rank: whether elevated accruals are company-specific or industry-wide (retailers' inventory builds together; software companies' deferred revenue moves together)
- Top-quintile danger-zone band: the Sloan study's high-accrual bucket, shaded for visibility
- Earnings-surprise overlay: quarters with GAAP earnings beats on high accruals are flagged for read-through skepticism
Reading the signal
Widening accruals + receivables days growing faster than revenue. Classic channel-stuffing tell, the company is booking revenue that customers aren't paying for. When receivables grow 30% while revenue grows 10%, the incremental revenue has a 3× longer collection period than existing revenue, which usually means the sales are less certain or pulled forward into the quarter via end-of-period customer incentives. Persistent over multiple quarters = aggressive recognition.
Widening accruals + inventory days exploding. The inventory-glut pattern that precedes guidance cuts in retail, apparel, and hardware. Product is sitting on shelves longer because demand is softer than management forecast. The markdown hasn't been taken yet because management is hoping demand returns. When it doesn't, the markdown eventually shows up as a one-time charge, impairing margins and usually triggering a guide-down.
Cyclical accruals vs. persistent accruals. Working capital expanding into a growth phase is normal and self-correcting, the business is investing to support higher future volumes. The warning signal is persistent high accruals across multiple quarters without corresponding cash-flow improvement or clear growth-investment narrative. The card's 20-quarter view distinguishes cyclical from persistent; one-quarter spikes aren't the worry.
Deferred revenue dynamics for subscription businesses. For SaaS and subscription businesses, deferred revenue is a cash asset ahead of recognized revenue. A large deferred revenue balance is a feature, not a bug, and it pushes accruals in a direction that looks risky but isn't. Read the decomposition to distinguish.
Example: a three-quarter accrual warning
A consumer-discretionary name I was short in 2022:
| Quarter | Revenue growth | EPS growth | Accruals pctile | DSO | Inventory days |
|---|---|---|---|---|---|
| Q1 2022 | +12% | +15% | 62nd | 51 | 92 |
| Q2 2022 | +10% | +17% | 78th | 58 | 104 |
| Q3 2022 | +8% | +19% | 89th | 64 | 117 |
| Q4 2022 | +5% | +21% | 94th | 71 | 128 |
The headline earnings kept "beating", faster EPS growth than revenue growth, which the sell-side read as margin expansion. The accruals view showed the opposite: DSO expanded from 51 to 71 (40% longer collection period), inventory days from 92 to 128 (40% more inventory per revenue dollar). The "margin expansion" was working-capital-driven, not real. I added to the short in Q3 2022 after the Q3 print confirmed the pattern hadn't reversed. Q1 2023 the company pre-announced a major markdown, FY guidance cut, and stock dropped 28% in two days. The accrual pattern had been visible a full year before the guide-down.
What accruals can mask
- Deliberate working-capital investment. A manufacturer building pre-tariff inventory or a distributor expanding into a new region legitimately needs more working capital temporarily. The decomposition helps separate these from accrual manipulation.
- Acquisitions. Buying a company adds receivables, inventory, and payables overnight, distorting accruals for 1–2 quarters post-close. The card flags M&A quarters.
- Seasonality. Retailers build inventory pre-holiday and draw it down post-holiday; the aggregate accrual measure on a single quarter can be misleading. TTM or YoY-same-quarter comparisons are more reliable.
- Write-offs and impairments. Large one-time non-cash charges flip accruals temporarily in a direction that's actually the correction, not the problem.
Common mistakes
- Using accruals in isolation. Combine with F-Score and cash-conversion ratio. High accruals + clean F-Score is less concerning than high accruals + falling F-Score.
- Ignoring sector base rates. SaaS accruals look high because of deferred revenue dynamics; that's structural, not a warning. Read sector percentile, not absolute level.
- Reading one quarter. Accruals fluctuate quarter-to-quarter. The danger pattern is persistence, not a single spike.
- Skipping the decomposition. "High accruals" can mean receivables, inventory, deferred revenue, or other. The implications differ by driver.
- Assuming a cash-flow statement is untainted. Cash flow can also be manipulated (reclassifying financing to operating), but it's much harder than manipulating accruals. CFO is the more honest number.
Where it fits
Accruals Quality pairs with the Piotroski F-Score and Altman Z-Score as three complementary quality lenses. Low F-Score + high accruals + declining Z is the classic restatement-or-fraud trio. For valuation sanity, also pull FCF Yield, a reported-earnings yield that doesn't show up in FCF yield is usually the accrual story in disguise.
FAQ
Is high accruals always bad?
No. Growth-investing companies need working-capital expansion, which produces accruals. The distinction is whether cash flow eventually follows or doesn't. Persistent divergence without operational improvement is the warning.
How do I apply accruals to asset-light businesses?
Asset-light SaaS and platforms have smaller working-capital bases; accruals are a noisier metric at small base. For these, the deferred-revenue-growth analysis and cash-conversion-ratio are more informative than pure Sloan accruals.
Does the Sloan effect still work in 2026?
The effect has persisted in most out-of-sample replications, though the magnitude has compressed somewhat as it's become better-known. Still one of the more robust cross-sectional signals in fundamental investing.
How does this interact with revenue recognition rule changes (ASC 606)?
ASC 606 standardized revenue recognition timing for many industries in 2018, reducing the range of discretion in accrual construction. Pre-2018 vs. post-2018 comparisons should account for this.
Can I screen on accruals?
Yes, the Screener supports accruals-percentile filters. A screen of "accruals above 80th percentile, 4 consecutive quarters, negative F-Score change" is a reasonable quality-short candidate list.
Related reading
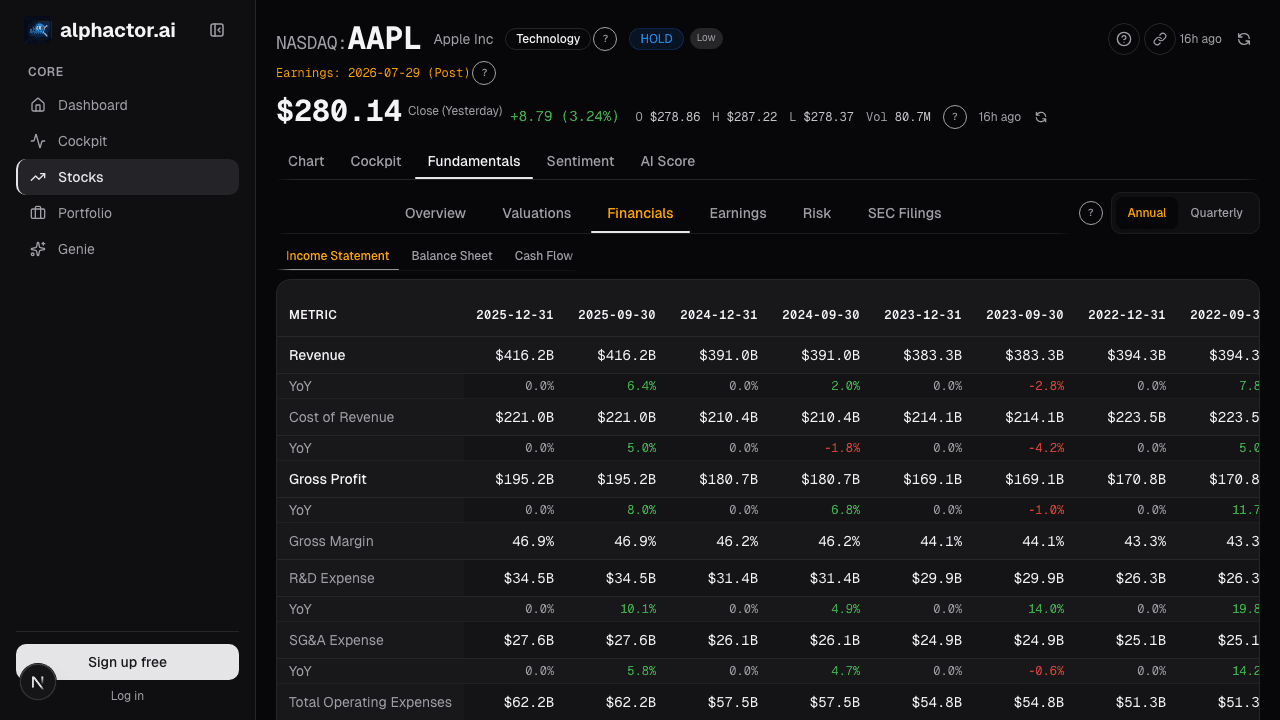
Open the Accruals Quality card → /app/stocks/AAPL/fundamentals
See it in the app
Live dashboard views that match this post. Each tile deep-links to the exact card.

Stocks mentioned
Related reading
Altman Z-Score: A Bankruptcy Predictor That Still Works
Edward Altman's 1968 discriminant model predicts bankruptcy within two years about 72% of the time at its distress threshold.
Balance Sheet Deep Dive
Balance sheet changes lead income statements by 2-6 quarters. Net debt, receivables days, and goodwill are the lines that move stocks first.
Cashflow Waterfall: From Operating Cash to Free Cash
Operating cash flow is cleaner than net income but still not distributable cash. The waterfall makes every deduction visible, SBC, working capital, capex …
Debt-to-Equity Ratio
How to evaluate a company's debt load, when leverage creates value, when it destroys it, and the sector-specific thresholds that matter.
The Dividend Yield Trap: When High Yield Signals Danger
Why chasing the highest dividend yields is one of the most common mistakes income investors make, and how to identify sustainable dividends.
Earnings History
Each stock has an earnings personality. Twelve quarters of per-ticker history reveals beat-miss cadence and drift patterns that aggregate statistics mask.
Ready to try alphactor.ai?
Validate your trading strategies with statistical credibility testing. Start free.
Get Started Free