Part of: Fundamental Analysis
Earnings History
Each stock has an earnings personality. Twelve quarters of per-ticker history reveals beat-miss cadence and drift patterns that aggregate statistics mask.
 Sarah Patel6 min read
I've held a certain large-cap enterprise software name for eight years. Over those 32 quarters I've noticed a consistent pattern: it beats revenue but barely meets or slightly misses EPS, same-day returns average about -1.5%, and then the stock drifts up by 4-7% over the 30 days following the print. Every single time, not 80% of the time, *every* time, I've watched the first-day reaction convince retail to sell and then watched the drift reward patient holders over the next month. The pattern is visible only because I've tracked 32 quarters of the same ticker's reports; aggregate statistics about "tech stocks" or "software earnings" would mask it entirely. In Q3 2023 I pitched a colleague to add the name after it dropped 3% on the print; he'd never owned it and asked why I was buying weakness. I showed him the 12-quarter history: the beat-revenue-miss-EPS cadence, the -1-to-2% same-day move, the 30-day drift. He added; the stock drifted 6% over the next four weeks. That's the actual use-case of the earnings history card, it teaches you how a specific name reports so you can trade the name's personality, not the aggregate.
This post is about the Earnings History card, why per-ticker reporting pattern is under-priced alpha, and the three patterns that convert 12-quarter history into trade decisions.
TL;DR
- Each name has an earnings personality: beat-miss cadence, same-day magnitude, drift pattern, visible only in per-ticker history.
- Revenue beat + EPS miss repeated 3+ quarters = margin pressure. Growth is real; cost leverage is not.
- High-drift names are an alpha factor. Strong beats in these names drift 5-15% over 30 days.
- High beat rate + tight consensus dispersion = small moves. The edge is in the guidance, not the print.
- Same-day move vs. 30-day move are different trades. Different thresholds, different sizes.
Why aggregate earnings statistics miss it
"Most stocks beat consensus" is true and unhelpful. What matters for trading a specific name is whether *this* name beats *its* consensus in *its* characteristic pattern, and how the market has historically priced those surprises. Aggregate statistics mix thousands of names with different reporting personalities: high-beta tech that moves ±12% on the print, low-vol staples that move ±2%, high-drift industrials that run 10% over a month post-beat, anti-drift consumer names that give back the same-day move within a week.
The per-ticker history is where those personalities live. Twelve quarters of data on a single name reveals:
- Beat rate and surprise size distribution: is this a name that beats routinely or inconsistently?
- Same-day move characteristics: magnitude, direction bias, IQR
- Post-earnings drift: does the name continue in the surprise direction, or mean-revert?
- Guidance-driven vs. print-driven reactions: does the same-day move correlate with EPS surprise or with guidance?
- Revenue-vs-EPS dynamic: beat both, beat revenue miss EPS, beat EPS miss revenue
Without that history, you're trading an aggregate shape that may or may not apply to your specific name.
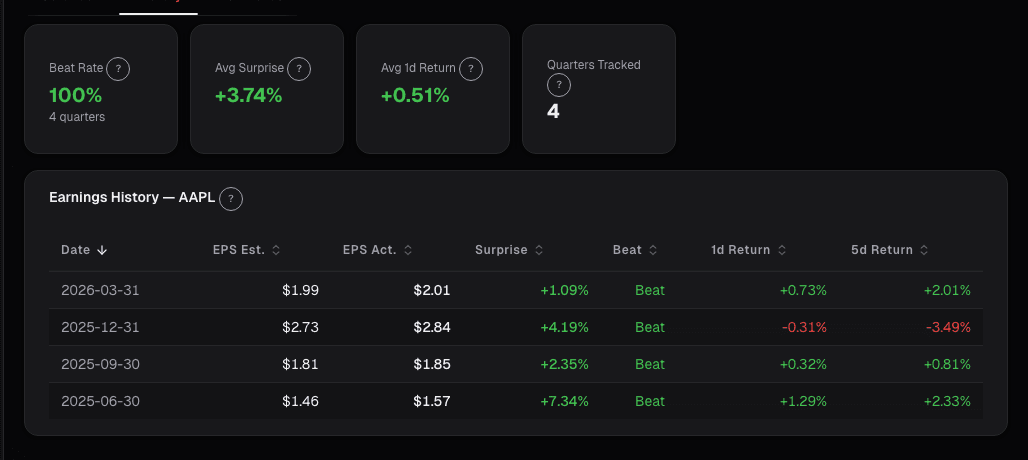
What the Earnings History card shows
The Earnings History card lists the last 12 quarterly reports for the selected ticker:
- EPS actual vs. consensus with surprise %
- Revenue actual vs. consensus with surprise %
- Same-day return (close-to-close on report day)
- 1-week return (5-trading-day)
- 1-month return (21-trading-day, the "drift" window)
- Guidance revision: raised / reaffirmed / lowered / withdrawn
- Summary strip: average beat rate, average same-day magnitude, mean drift by surprise direction
- Cadence-deviation flag: when a specific quarter's behavior differs from the historical pattern
- Options-implied-move context: how the market's forward expectation compares to historical realized
Three patterns that convert history to decisions
Beat rate > 80% with tight consensus dispersion = small moves. Names that beat almost every quarter have been figured out by the buy-side. Analyst estimates cluster tightly around the same number, and "beats" are really just meeting the whisper number. Same-day moves are usually ±2%, and the trading edge isn't in the print, it's in the *guidance*. Watch the forward-guidance delta more carefully than the backward EPS beat; the guidance surprise is where the alpha lives for these names.
High post-earnings drift on beats = alpha factor. Some names have historical post-earnings drift characteristics: a beat of > 1 standard deviation in surprise correlates with a 5-15% drift in the surprise direction over 30 days. This is the post-earnings announcement drift (PEAD) phenomenon, well-documented in academic literature but very name-specific in practice. The card flags names with strong historical drift; adding into strength 1-2 days post-print on these has historically been a profitable pattern.
Revenue beats with EPS misses for 3+ quarters = margin pressure. When a name repeatedly reports top-line strength but can't translate it to bottom-line, the cost structure is losing leverage. The growth is real but the margin story is deteriorating. These names often become shorts (if the degradation continues) or waits (if it stabilizes). Three quarters of the pattern is a serious warning; four quarters is a structural problem usually priced in only after the fourth report.
Example: the eight-year enterprise software pattern
The 12-quarter summary of the name I've held:
| Metric | Value |
|---|---|
| Revenue beat rate | 11/12 quarters (92%) |
| EPS beat rate | 4/12 quarters (33%) |
| Average revenue surprise | +1.8% |
| Average EPS surprise | -0.3% |
| Average same-day return | -1.5% |
| Average 1-week return | +0.2% |
| Average 30-day return post-print | +5.4% |
| Guidance revised UP | 9/12 quarters |
The pattern: reliably beats revenue, barely meets EPS (investments in growth are the cost leverage drag), same-day reaction mildly negative, guidance consistently stronger than consensus, 30-day drift reliably positive. Trading rule: don't chase the same-day move; add on the 3-5% post-print weakness and hold for the 30-day drift. The rule has worked in 10 of the last 12 quarters. The two exceptions were both macro-event quarters (March 2020 COVID, Oct 2022 rate shock) where name-specific patterns got overridden by regime.
What earnings history can miss
- Regime shifts. Patterns from 12 quarters of stable market regime may not hold through a recession or rate shock.
- Management changes. A new CFO can change the consensus-management relationship; old patterns may break.
- Business-model transitions. A name transitioning from license to subscription, or hardware to services, changes its reporting rhythm.
- Accounting changes. New revenue recognition rules, lease accounting, segment restatements, all distort YoY comparisons within the 12-quarter window.
- Small samples on rare events. Stock split effects, dividend initiations, M&A-heavy quarters, 12 quarters may not contain enough of these to be diagnostic.
Common mistakes
- Trusting a 2-quarter pattern. Patterns need 6+ quarters to stabilize; the card flags when fewer are available.
- Ignoring the guidance column. For high-beat-rate names, guidance dominates print reactions.
- Assuming a beat = up. Revenue beat + EPS miss is a coin flip on direction; doesn't imply up.
- Trading same-day without context. The 30-day drift is often the more reliable signal than the same-day move.
- Applying the pattern across regimes. A low-vol-regime pattern often doesn't hold in high-vol or crisis regimes.
Where it fits
Pair with Earnings Calendar for the upcoming reports, Earnings Estimates for the consensus set-up, Portfolio Earnings for the book-level view, and the fundamentals-side Earnings History for the deeper per-ticker drill-in with surrounding fundamentals.
FAQ
How many quarters does the card show?
12 quarters by default, 20 for names with longer history. Extended view helps identify regime-specific patterns.
Is post-earnings drift computed on raw or market-adjusted returns?
Raw by default, market-adjusted toggle available. For alpha screening, market-adjusted is the right view.
What about pre-announcements and mid-quarter guidance?
Pre-announcements are flagged separately and excluded from the standard print-day summary. Mid-quarter guidance updates are available in the card's event timeline.
Can I compare earnings personality across names?
Yes, a cross-ticker view is available in the screener, with filters for beat rate, drift magnitude, and same-day volatility.
Does the card handle accounting changes?
New-standard transitions are flagged in affected quarters; YoY comparisons in those periods are marked as distorted.
Related reading
- Accruals Quality, Earnings Manipulation
- Portfolio Earnings Cycle
- Earnings Season Checklist
- Earnings Season Guide
Open the Earnings History card → /app/earnings
See it in the app
Live dashboard views that match this post. Each tile deep-links to the exact card.

Stocks mentioned
Related reading
Accruals Quality: How to Spot Earnings That Aren't Real
Accruals measure the gap between reported earnings and actual cash. Widening accruals is one of the most reliable red flags in financial analysis, Sloan's…
Earnings Season Checklist: What to Watch Before, During
A structured approach to earnings season: how to prepare, what metrics matter on the call, and how to interpret post-earnings price action.
How Earnings Season Actually Moves Markets
Why the market's reaction to earnings reports depends on guidance, positioning, and expectations far more than the headline EPS number.
How to Analyze a Company Before Earnings in 15 Minutes
A 15-minute pre-earnings checklist covering guidance revisions, balance sheet flags, and estimate dispersion using Alphactor tools: no deep-dive report needed.
Portfolio Earnings: Calendar, Exposure
Earnings risk is about the whole book into the week, not each position. When 40% of NAV reports in one week, and 60% of that is in a single sector, you're…
Ready to try alphactor.ai?
Validate your trading strategies with statistical credibility testing. Start free.
Get Started Free