Part of: Risk Management
Portfolio Earnings: Calendar, Exposure
Earnings risk is about the whole book into the week, not each position. When 40% of NAV reports in one week, and 60% of that is in a single sector, you're…
 Marcus Chen7 min read
In late January 2024 I was reviewing my book ahead of the big-tech earnings week, MSFT, GOOGL, META, AAPL, AMZN all reporting within five trading days. Individually, each position looked sized correctly: none exceeded my 6% max-single-position limit, each had its own risk budget, each had been in the book long enough to justify holding through the print. What I hadn't done was aggregate. When I finally ran the portfolio-level earnings view, the book showed 42% of NAV reporting in that five-day window. Of that 42%, roughly 75% was in large-cap tech. A single-week earnings disappointment in tech could move the book by 4-6% before anything else happened, an order of magnitude more than any individual position could move me. The per-stock risk was fine; the cluster risk was not. I ended up trimming three positions by 20-30% going into the prints and re-adding after the volatility compressed post-report. The adjusted book ended up roughly flat through the event week; the unadjusted version would have been ±4%. Neither "better", but one was an explicit risk choice and the other was accidental. The portfolio-earnings view is what forced me to see that choice as a choice.
This post is about the Portfolio Earnings card, why a book-level event view is irreplaceable, and the three practices that turn earnings season from a volatility surprise into a structured risk decision.
TL;DR
- Position-by-position earnings review is fine on small books, a liability on larger ones. 30+ names require aggregation.
- Clustering warnings matter more than individual names. 40% of NAV reporting in one week is concentrated event risk.
- Options-implied-move > 10% is the threshold for trim or collar decisions. Below that, ride through.
- Post-earnings drift is a real alpha factor. Strong beat + drift = add, not trim.
- Hedge suggestions are optional. Most books can ride earnings without explicit hedges; know before the event, don't decide during it.
Why position-level earnings views miss risk
Looking at earnings one position at a time works fine for 3-5-name portfolios. At 20-30+ names, it stops working because the risk that matters is the aggregate, not the per-position. A single-stock earnings review answers "how much can position X move on the print?", useful but incomplete. It doesn't answer:
- Which weeks have 40%+ of NAV reporting?
- Is the earnings-week concentration clustered in one sector?
- What is the portfolio's total options-implied-move exposure in a given week?
- Are two positions likely to move together on related prints (supplier/customer relationships)?
Those are the decisions earnings season actually hinges on. A portfolio-earnings view is the only way to answer them without manual aggregation work.
The other failure mode of per-position review is psychological: each individual position feels fine, so the book feels fine, even when the aggregate exposure is extreme. Clustering warnings at the book level override the "each one is sized OK" intuition.
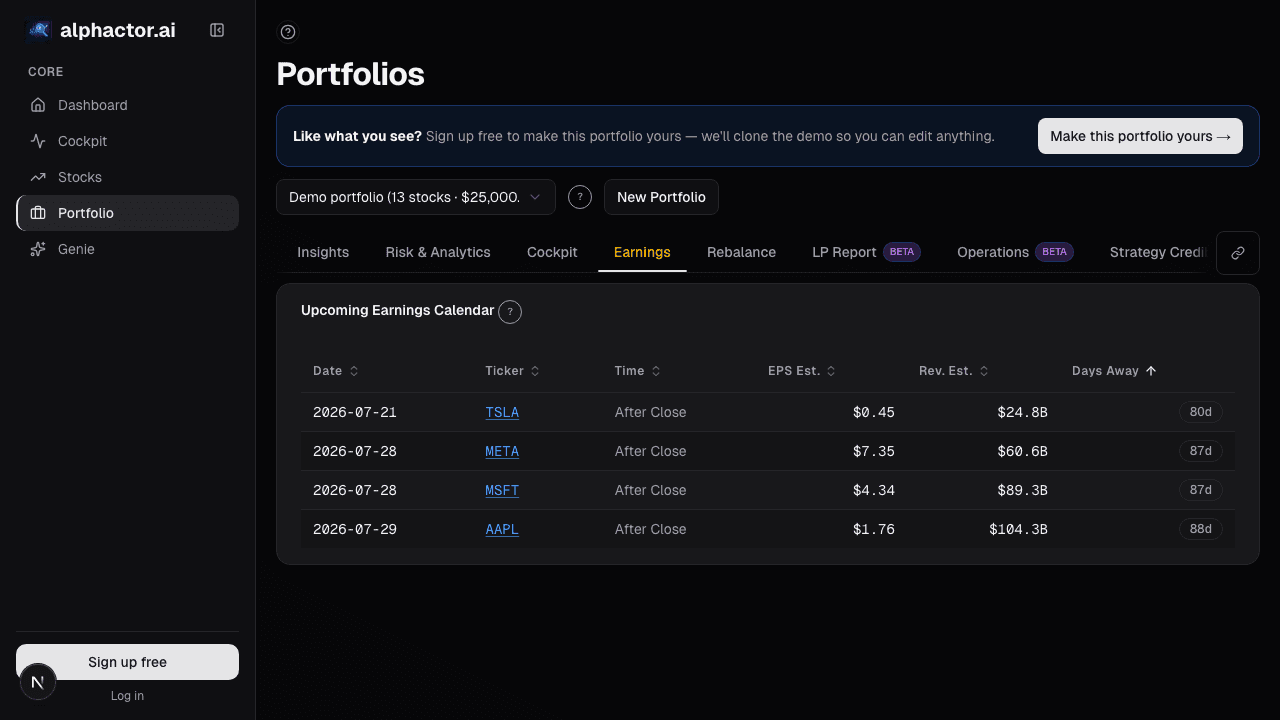
What the Portfolio Earnings card shows
The Portfolio Earnings card groups upcoming reports by week for the next 8 weeks:
- Ticker, position weight, report date and session (before/after market)
- Consensus EPS and revenue estimates with prior-quarter and YoY comparison
- Historical post-earnings move: mean and IQR of 1-day return across the last 8 reports
- Options-implied-move today: the market's current expectation, comparable to history
- Weekly NAV summary bar: total % of NAV reporting each week
- Clustering warning: flags when any week has > 25% of NAV reporting
- Sector concentration in reporting weeks: secondary warning for clustered sector exposure
- Post-earnings-drift indicator: names historically showing drift 5+ days post-print
- Hedge suggestion row: sector-ETF or index-option structures for earnings-heavy weeks
- Per-position trim-rule checkbox: automatic trim trigger when implied-move exceeds threshold
Three practices that matter
Pre-commit trim rules for names with implied-move > 10%. When the options market is pricing a 10%+ expected move into the print, the distribution of outcomes is wide enough that the expected value of the position is roughly unchanged, you're just taking volatility for no expected return. Either reduce size going in (25-30% trim, re-add after the print) or add a collar (paid for by the call-wing premium if IV rank is elevated). The math on collars is favorable when implied-move is that rich, the call premium usually covers most of the put cost.
Check the weekly bar for clustering, especially sector clustering. If week 3 has 35% of NAV reporting and 60% of that is in one sector, you're taking concentrated sector risk even if each individual position is sized fine. The fix is either to trim one or two of the most-concentrated positions, or to take a sector-ETF hedge sized to offset the cluster. The clustering warning in the card makes this visible without manual aggregation; without the warning, the clustering tends to go unnoticed until the week actually hits.
Review post-earnings drift 5 trading days after the print. Names showing strong drift (> 2% one-sided continuation) 5 days post-print are the ones worth adding to, not trimming. Post-earnings drift is one of the most persistent factors in equity returns, especially for names with > 1 standard deviation earnings surprise. The card flags likely drift candidates based on historical patterns; your job is to follow up 5 days later and adjust sizing based on the actual drift.
Example: January 2024 tech earnings week
My portfolio earnings summary for the week in question:
| Ticker | Weight | Date | Implied Move | Historical Mean Move |
|---|---|---|---|---|
| MSFT | 7.2% | Tue AMC | ±5.1% | ±4.0% |
| GOOGL | 6.5% | Tue AMC | ±5.8% | ±5.2% |
| AAPL | 8.1% | Thu AMC | ±4.3% | ±3.8% |
| META | 5.4% | Wed AMC | ±8.2% | ±9.1% |
| AMZN | 6.8% | Thu AMC | ±6.9% | ±7.4% |
| Smaller tech names | 8.0% | Various | ±6-12% | ±5-11% |
| Total reporting | 42.0% |
42% of NAV reporting in one week, 75% of that in large-cap tech. Cluster risk was extreme. Trim decisions: cut MSFT, GOOGL, and AAPL each by 25% ahead of the prints (not because I disliked them, I planned to re-add, but to reduce cluster risk). Left META and AMZN untouched (smaller weights, different business exposures). The adjusted book had about 30% of NAV reporting, still high but no longer extreme. Through the five-day window the portfolio ended roughly flat; re-added the trimmed positions on post-earnings weakness the following week. The trim-and-re-add netted out close to zero; the reduced cluster risk was the real benefit.
What the card can miss
- Pre-announcements. A company can preannounce before the scheduled date; the card reflects the official schedule.
- Guidance surprises. The earnings table shows EPS/revenue consensus; forward-guidance surprises can dominate post-print moves and aren't in consensus tables.
- Sympathy moves. A supplier print can move downstream names even if they aren't reporting. The clustering view captures some of this but not all.
- Options-market bias. Implied move is a forward-looking estimate; it can over- or under-shoot realized move systematically in different regimes.
- Delisted / acquired names. Names with pending corporate actions may have scheduled earnings that don't actually report; the card flags but doesn't always catch last-minute changes.
Common mistakes
- Per-position earnings review on a 30-name book. Too much data, missing the aggregate.
- Ignoring sector clustering. 40% of NAV reporting distributed across 6 sectors is a different risk than 40% concentrated in tech.
- Trimming every name at implied-move > 10%. Some implied moves are reliably high and always priced in; case-by-case with historical context.
- Missing post-earnings drift. Trimming a strong beat the day of the report captures some profit but misses the 5-10% drift that often follows.
- Deciding during the week. Decisions about trims and hedges should be made a week prior; mid-week decisions under stress tend to be worse.
Where it fits
Pair with Earnings Calendar for the market-wide view, Portfolio Holdings for the position context, and per-ticker Earnings History to study individual reporting patterns. For the implied-volatility context on each name, cross-reference Options Key Metrics.
FAQ
How far ahead does the calendar show?
8 weeks by default, 12 weeks on request. Beyond that, consensus estimates get too stale to be useful.
Are confirmed dates different from estimated dates?
Yes, unconfirmed dates (company hasn't officially announced) are flagged with a clock icon. Treat as approximate.
Does it handle BMO vs. AMC correctly?
Yes, session-aware. BMO (before market open) and AMC (after market close) are separated because the available reaction window differs.
Can I set a rule for auto-trim on high implied-move?
Yes, the trim-rule checkbox on each row triggers a trim suggestion when implied-move crosses threshold. Actual execution is manual.
What's the source for historical earnings moves?
The last 8 quarters of 1-day post-earnings returns, from Polygon/IEX market data. The IQR captures the distribution width.
Related reading
Open the Portfolio Earnings card → /app/portfolio
See it in the app
Live dashboard views that match this post. Each tile deep-links to the exact card.

Stocks mentioned
Related reading
In a Crisis, All Correlations Go to One
Diversification fails exactly when you need it most. Here is why correlations spike during crises and how to build portfolios that survive it.
A 30% Drawdown Requires a 43% Gain to Recover
A 30% drawdown requires a 43% gain to recover. The asymmetric math explained, with sizing rules to prevent one bad trade from permanently impairing the account.
Earnings History
Each stock has an earnings personality. Twelve quarters of per-ticker history reveals beat-miss cadence and drift patterns that aggregate statistics mask.
How Earnings Season Actually Moves Markets
Why the market's reaction to earnings reports depends on guidance, positioning, and expectations far more than the headline EPS number.
Why Maximum Drawdown Is More Important Than Annual Return
Maximum drawdown reveals what your portfolio almost did to you. Here is why it matters more than the number everyone brags about.
Portfolio Credibility
Conviction is self-reported; credibility is externally anchored. The two diverge exactly where mistakes live, an 8% position in a name you love with a…
Ready to try alphactor.ai?
Validate your trading strategies with statistical credibility testing. Start free.
Get Started Free