Blog /
#risk
14 posts tagged risk.
14 posts
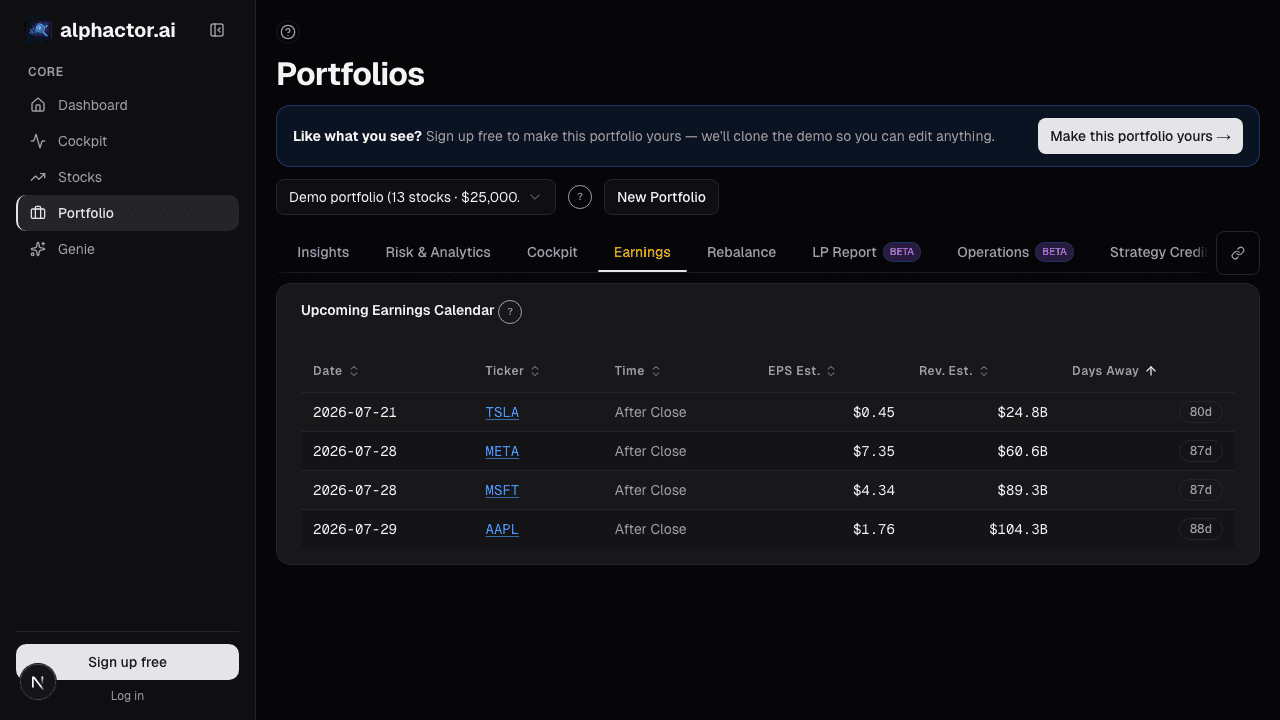
Portfolio Earnings: Calendar, Exposure
Earnings risk is about the whole book into the week, not each position. When 40% of NAV reports in one week, and 60% of that is in a single sector, you're…

Factor Exposure
Factor exposures are bets whether or not you chose them. Decomposition surfaces unintentional tilts before a rotation exposes them as underperformance.

FX Exposure: The Currency Risk Hiding in Your USD Portfolio
You bought US stocks in dollars, so you have no FX risk, right? Wrong. US large-cap multinationals earn 40-60% of revenue abroad.

A Position Sizing Framework That Won't Keep You Up at Night
A practical position sizing approach built on simplified Kelly criterion, risk-per-trade limits, and portfolio-level allocation guardrails.

Risk Management for Retail Portfolios
Practical position sizing, stop-loss strategies, correlation awareness, and drawdown limits for retail investors managing their own money.

The 5 Position Sizing Mistakes That Blow Up Accounts
Position sizing errors kill more accounts than bad stock picks. Here are the five most common mistakes and how to avoid each one.

Value at Risk in Plain English
VaR is the most widely used risk metric in finance. It is also the most misunderstood. Here is what it actually means and where it fails.

In a Crisis, All Correlations Go to One
Diversification fails exactly when you need it most. Here is why correlations spike during crises and how to build portfolios that survive it.
Survivorship Bias: The Invisible Flaw in Your Stock Screener
Survivorship bias silently inflates backtest returns and warps stock screener results. Here is how it works and what to do about it.

Revenge Trading: How One Bad Day Becomes a Bad Month
Revenge trading is the single fastest way to turn a manageable loss into a catastrophic one. Here is how it works and how to break the cycle.
Why Maximum Drawdown Is More Important Than Annual Return
Maximum drawdown reveals what your portfolio almost did to you. Here is why it matters more than the number everyone brags about.
Stop Losses: Fixed, Trailing, or Volatility-Based
A practical comparison of fixed, trailing, and volatility-based stop losses with real scenarios showing when each type works and fails.