Part of: Risk Management
Factor Exposure
Factor exposures are bets whether or not you chose them. Decomposition surfaces unintentional tilts before a rotation exposes them as underperformance.
 Marcus Chen7 min read
In mid-2022 I ran the factor decomposition on a book I'd been telling myself was "diversified across sectors with no particular style tilt." The decomposition said +1.1 on momentum, -0.6 on value, +0.4 on quality. That's not "diversified" in any factor sense, it's an active momentum-over-value bet sized at roughly one standard deviation above the Russell 3000. I hadn't picked that bet consciously. What had happened was that over the prior 18 months I'd been adding to winners and trimming losers, which is textbook momentum tilt without being labeled that way, and I'd been buying names with accelerating revenue growth, which tends to correlate with momentum. My "neutral diversified" book was actually running a concentrated factor position I hadn't chosen. When the momentum-to-value rotation hit in late 2022, the book dropped 14% in two months while my benchmark dropped 7%. The factor attribution showed that 9 of the 14 points of underperformance came from the momentum factor, not bad stock picks, but a factor exposure I hadn't been managing. If I'd known about the tilt before the rotation, I could have either hedged it explicitly or owned the risk consciously. I'd done neither, because I'd been thinking at the ticker level and the bet lived at the factor level.
This post is about the Factor Analysis card, why factor decomposition is the right lens for portfolio risk, and the three interpretation rules that turn decomposition output into active risk management.
TL;DR
- Factor exposures are bets whether you chose them or not. Unchosen bets are the dangerous kind.
- Factor contribution to return is often larger than stock-specific contribution. Check before claiming picker-skill.
- Unintentional exposures drift in from trading behavior. Adding to winners = momentum tilt.
- Six factors cover most risk: value, momentum, quality, size, low-volatility, profitability.
- Monitor drift quarterly. Factor tilts shift as positions turn over.
Why factor decomposition is the right lens
At the ticker level, two books with zero overlap look uncorrelated. They aren't. A book of high-FCF compounders and another book of high-ROIC, low-leverage names are both expressing the same quality factor, they rally together in quality regimes and sell off together in junk rallies. Factor risk is correlated even when ticker composition isn't.
What factor decomposition gives you that ticker-level analysis can't:
- True diversification assessment: are you actually diversified, or just holding different names with similar factor loadings?
- Attribution of returns: what percentage came from factor exposure vs. stock-specific skill?
- Regime-conditional expectations: how will this book likely behave in the next factor rotation?
- Unintentional-bet detection: what am I implicitly betting on that I didn't choose?
- Hedge sizing: if I want to cancel a factor exposure, how much and in what?
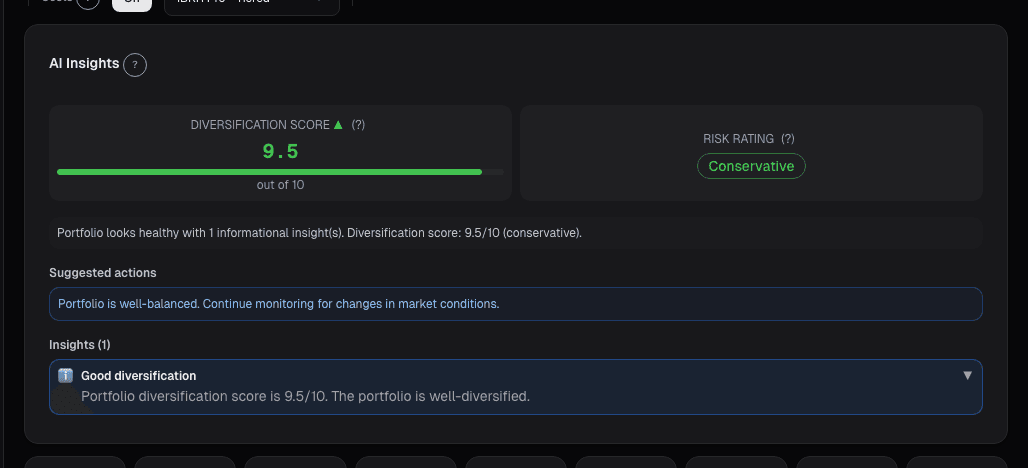
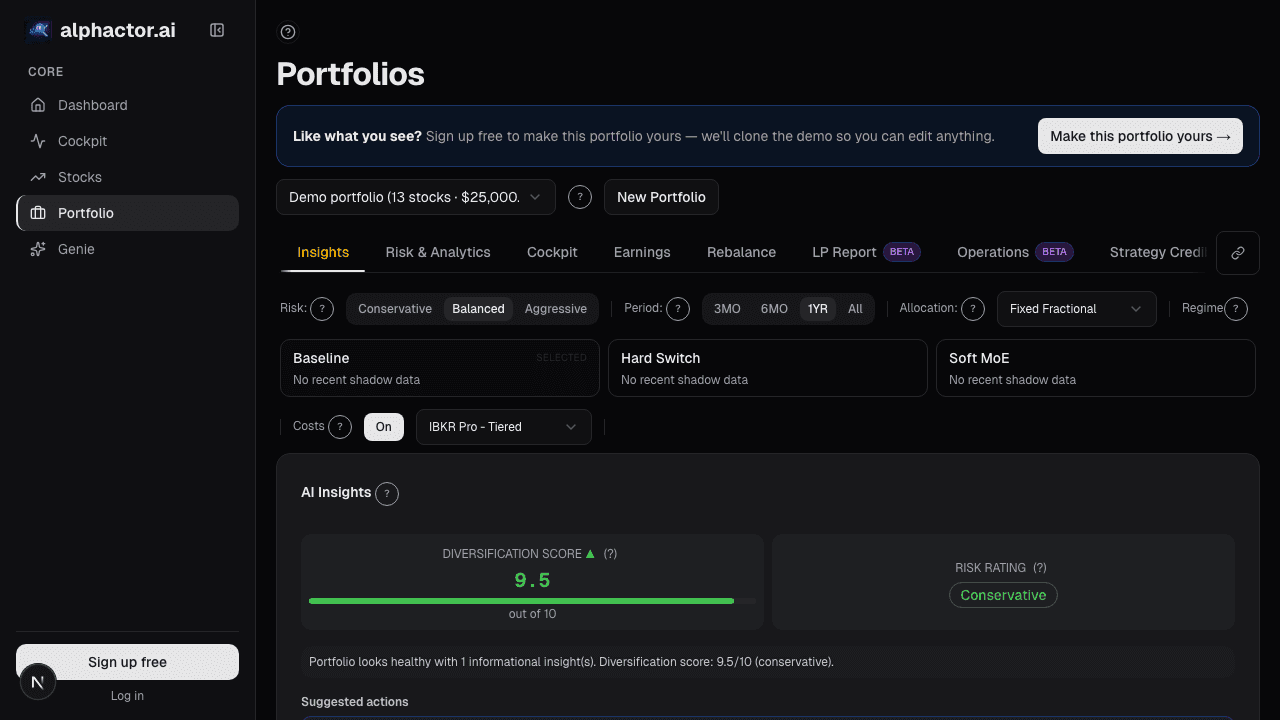
What the Factor Analysis card shows
The Portfolio Factor Analysis card decomposes the book's weighted exposure to six durable factors:
- Value: book/price, earnings/price, EV/EBITDA-based composite
- Momentum: 12-1 month price (standard academic definition, skipping last month to avoid reversal)
- Quality: ROIC, gross margin stability, accruals quality composite
- Size: market cap tilt (small vs. large)
- Low-volatility: trailing 180-day realized vol
- Profitability: gross profit / assets (Novy-Marx factor)
Each exposure is z-scored against the Russell 3000:
- +1 means one standard deviation more exposed than the index
- -1 means one standard deviation less exposed
- Absolute magnitudes > 0.5 are material; > 1.0 are concentrated factor bets
Additional views:
- Historical drift: how each exposure has evolved over the last 12 months
- Contribution to YTD return: decomposed into factor vs. stock-specific
- Per-position factor loading: which holdings drive each factor
- Hedge suggestions: long/short ETF structures to neutralize specific tilts

Three interpretation rules
Factor tilts are bets, size them as deliberate positions. If your book is +1.2 on momentum, you've made a momentum bet. This is fine if you chose it and want it; it's a problem if you didn't. Treat every factor exposure > |0.5| as requiring a deliberate answer: either "yes I want this" (in which case, size it, monitor it, know when to take it off) or "no, hedge it" (in which case, take the offsetting factor position). Either answer is better than "I didn't know I had it."
Factor contribution to return is often larger than stock-specific contribution. If you're +18% YTD and 15% of it came from the momentum factor, your ticker selection contributed only 3%. That's useful to know before you tell yourself you're a great stock picker. In strong single-factor regimes (2021 momentum, 2022 value-rotation, 2023 quality-and-size), factor contributions can account for 70-80% of total return. Good stock picking on top of a good factor bet is still skill, but knowing the decomposition prevents you from attributing all of it to one source.
Unintentional exposures are the dangerous ones. Intentional factor bets get monitored; you know when to take them off. Unintentional exposures drift in through trading behavior, adding to winners pulls momentum, buying on value screens pulls value, rotating into defensives pulls low-vol. A "diversified value portfolio" that has drifted to +1.1 on momentum is running a bet its manager would probably disown if asked. Quarterly factor decomposition catches this drift before a factor reversal exposes it.
Example: the 2022 momentum discovery
My decomposition in mid-2022, before I understood what was happening:
| Factor | Z-Score vs. Russell 3000 | Interpretation |
|---|---|---|
| Momentum | +1.1 | Material concentrated bet |
| Value | -0.6 | Moderate tilt away from value |
| Quality | +0.4 | Mild pro-quality tilt |
| Size | +0.3 | Slight small-cap tilt |
| Low-volatility | -0.3 | Slight pro-vol tilt |
| Profitability | +0.2 | Noise |
Three months later (mid-2022 factor rotation):
| Source of Return | Contribution |
|---|---|
| Momentum factor | -9.2% |
| Value factor | -1.1% |
| Quality factor | +0.4% |
| Size factor | -0.8% |
| Low-volatility factor | -2.0% |
| Profitability factor | +0.1% |
| Stock-specific | -1.4% |
| Total portfolio | -14.0% |
9.2 points of the 14-point drawdown came from the single momentum factor I hadn't known I was running. Stock picking contributed about 1.4 points of underperformance, the rest was a factor bet that reversed. If I'd seen the +1.1 momentum tilt three months earlier, I would have either trimmed the highest-momentum names or taken an explicit short in MTUM to neutralize. Having the decomposition available prevented this from being a repeat pattern.
What factor decomposition can miss
- Non-linear exposures. Options, leverage, and dynamic hedges have factor exposures that change with price; static decomposition may miss them.
- Custom factors. Sector-specific factors (e.g., semiconductor capex cycle, REIT rate sensitivity) aren't in the standard six.
- Regime-conditional loadings. Some names have different factor loadings in different regimes; the point-in-time decomposition is an average.
- Sample-period dependence. Factor definitions and loadings change slightly as the estimation window moves.
- Cross-factor interactions. Value and momentum interact (they're usually negatively correlated); treating them as independent misses some joint risk.
Common mistakes
- Assuming diversified sectors = diversified factors. Sector diversification and factor diversification are different.
- Ignoring drift. Factor tilts shift with trading; static snapshots miss evolution.
- Attributing all gains to stock picking. In single-factor regimes, most returns come from factor exposure.
- Treating |z-score| < 0.3 as material. Noise. Focus on the big tilts.
- Hedging a factor without understanding the cost. Factor hedges have their own drag in stagnant regimes.
Where it fits
Pair Factor Analysis with the Risk Metrics card for conventional vol/drawdown context and Regime Analysis to see whether your current factor tilts are well-suited to the current macro regime. When a factor contribution turns large and negative for 4+ weeks, it's usually time to examine whether the exposure is intentional or a byproduct of stale positions.
FAQ
How often does the card update?
Factor loadings update daily as position prices change. Factor definitions (the reference universe) update monthly.
What's the benchmark for z-scores?
Russell 3000 by default; toggleable to S&P 500, MSCI World, or a custom universe.
Can I add custom factors?
Premium feature, custom factor definitions can be added via the portfolio settings.
Does it handle leveraged or short positions?
Yes, short positions are treated as negative factor exposures; leverage amplifies the net tilt.
How should I think about the hedge suggestions?
Indicative only. Factor-hedge ETFs (MTUM, VLUE, QUAL, SIZE, USMV) approximate the factors but have their own tracking and management drag.
Related reading
Open the Factor Analysis card → /app/portfolio
See it in the app
Live dashboard views that match this post. Each tile deep-links to the exact card.


Related reading
In a Crisis, All Correlations Go to One
Diversification fails exactly when you need it most. Here is why correlations spike during crises and how to build portfolios that survive it.
A 30% Drawdown Requires a 43% Gain to Recover
A 30% drawdown requires a 43% gain to recover. The asymmetric math explained, with sizing rules to prevent one bad trade from permanently impairing the account.
Factor Investing in Plain English
Value, momentum, quality, size, and volatility: the five major investment factors explained without jargon, with practical applications for retail portfolios.
Why Maximum Drawdown Is More Important Than Annual Return
Maximum drawdown reveals what your portfolio almost did to you. Here is why it matters more than the number everyone brags about.
Portfolio Earnings: Calendar, Exposure
Earnings risk is about the whole book into the week, not each position. When 40% of NAV reports in one week, and 60% of that is in a single sector, you're…
FX Exposure: The Currency Risk Hiding in Your USD Portfolio
You bought US stocks in dollars, so you have no FX risk, right? Wrong. US large-cap multinationals earn 40-60% of revenue abroad.
Ready to try alphactor.ai?
Validate your trading strategies with statistical credibility testing. Start free.
Get Started Free