Factor Investing in Plain English
Value, momentum, quality, size, and volatility: the five major investment factors explained without jargon, with practical applications for retail portfolios.
 Marcus Chen4 min read
What Is a Factor?
A factor is a measurable characteristic of stocks that has historically explained differences in returns. If you have noticed that cheap stocks tend to outperform expensive ones over long periods, or that stocks going up tend to keep going up, you have already observed factor effects.
Academic research, starting with Fama and French in the 1990s, has identified several persistent factors that show up across markets, time periods, and geographies. Understanding them requires five basic ideas.
Value: Buying What Is Cheap
The value factor captures the tendency of stocks that are cheap relative to their fundamentals (low P/E, low price-to-book, high free cash flow yield) to outperform expensive ones.
The intuition: when a stock is beaten down, expectations are low. Even slightly better-than-expected performance reprices it higher. Expensive stocks need everything to go right just to justify their current price.
Value has worked over the very long term, with cheap stocks outperforming by roughly 3-4% annually in U.S. markets since 1926. But the factor goes through brutal stretches. From 2017 to 2020, value dramatically underperformed growth. Investors who abandoned it missed a sharp reversal in 2021-2022.
Practical application: Screen for stocks with below-median P/E and price-to-free-cash-flow within their sector. Combine with quality filters to avoid value traps.
Momentum: Following What Is Working
The momentum factor reflects the observation that stocks which performed well over the past 6-12 months tend to continue outperforming, and poor performers tend to keep underperforming.
This is counterintuitive, but momentum is one of the most robust factors in finance, documented across dozens of countries and more than a century of data. The likely drivers are behavioral: investors underreact to new information, trend-following creates positive feedback, and institutional rebalancing happens gradually.
Practical application: Rank stocks by their 12-month return, excluding the most recent month (which tends to show short-term reversal). Favor the top quartile. Combine with a value or quality overlay to avoid buying momentum into fundamentally weak businesses.
Quality: Owning Better Businesses
The quality factor captures the premium that high-quality businesses (high profitability, stable earnings, low leverage, strong ROE) earn over low-quality businesses.
A company earning 25% return on equity with consistent margins and modest debt is higher-quality than one earning 8% ROE with volatile margins and heavy leverage. Over time, the market rewards consistency with higher risk-adjusted returns.
Quality is particularly valuable during downturns. In the 2022 sell-off, companies with strong balance sheets and stable cash flows significantly outperformed highly leveraged businesses.
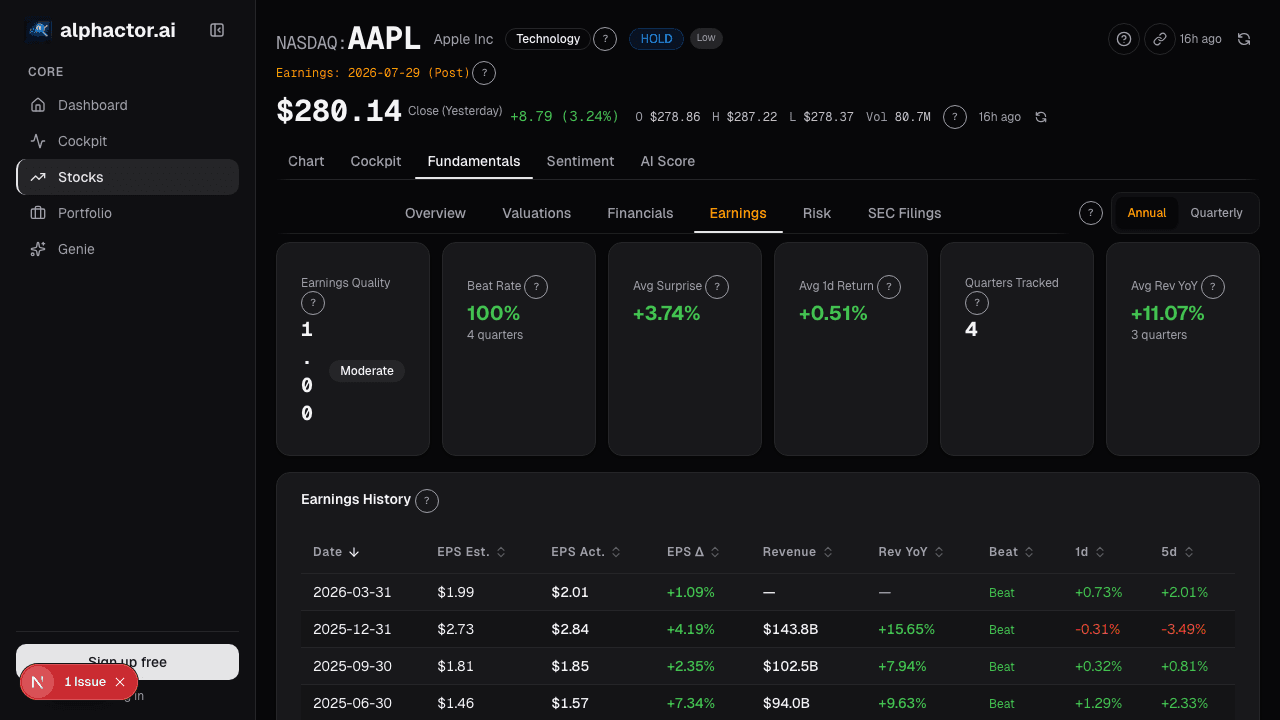
Practical application: Filter for return on equity above 15%, debt-to-equity below 0.5, and earnings variability in the bottom quartile. Alphactor's fundamentals view shows these metrics alongside sector benchmarks, making it easy to compare quality across peers.
Size: The Small-Cap Premium
The size factor reflects the historical tendency of smaller companies to outperform larger ones by roughly 2% annually, though this premium has been inconsistent in recent decades.
Smaller companies are riskier (less diversified, less liquid, more volatile), and investors demand compensation for bearing that risk. They also tend to be under-followed by analysts, creating more mispricing opportunities.
However, the raw small-cap premium includes a lot of microcap junk: tiny, unprofitable companies that more often go to zero than produce spectacular returns. Filtering for quality within the small-cap universe dramatically improves outcomes.
Practical application: Look at companies with market capitalizations between $1 billion and $10 billion that also pass quality and value screens.
Low Volatility: Less Risk, Surprisingly More Return
The low volatility factor is the most counterintuitive: stocks with lower historical volatility have delivered comparable or better returns than high-volatility stocks, despite bearing less risk.
The likely explanation is behavioral. Investors are drawn to exciting, volatile stocks and overpay for them. Boring, stable stocks get neglected and underpriced. During the 2008 financial crisis, low-volatility portfolios declined roughly 30% compared to 50%+ for the broad market. In strong bull markets, they lag. Over a full cycle, the lower drawdowns more than compensate.
Practical application: Rank stocks by trailing 12-month standard deviation of returns. The bottom tercile (least volatile) is your universe. Combine with value to avoid overpaying for stability.
Using Factors Together
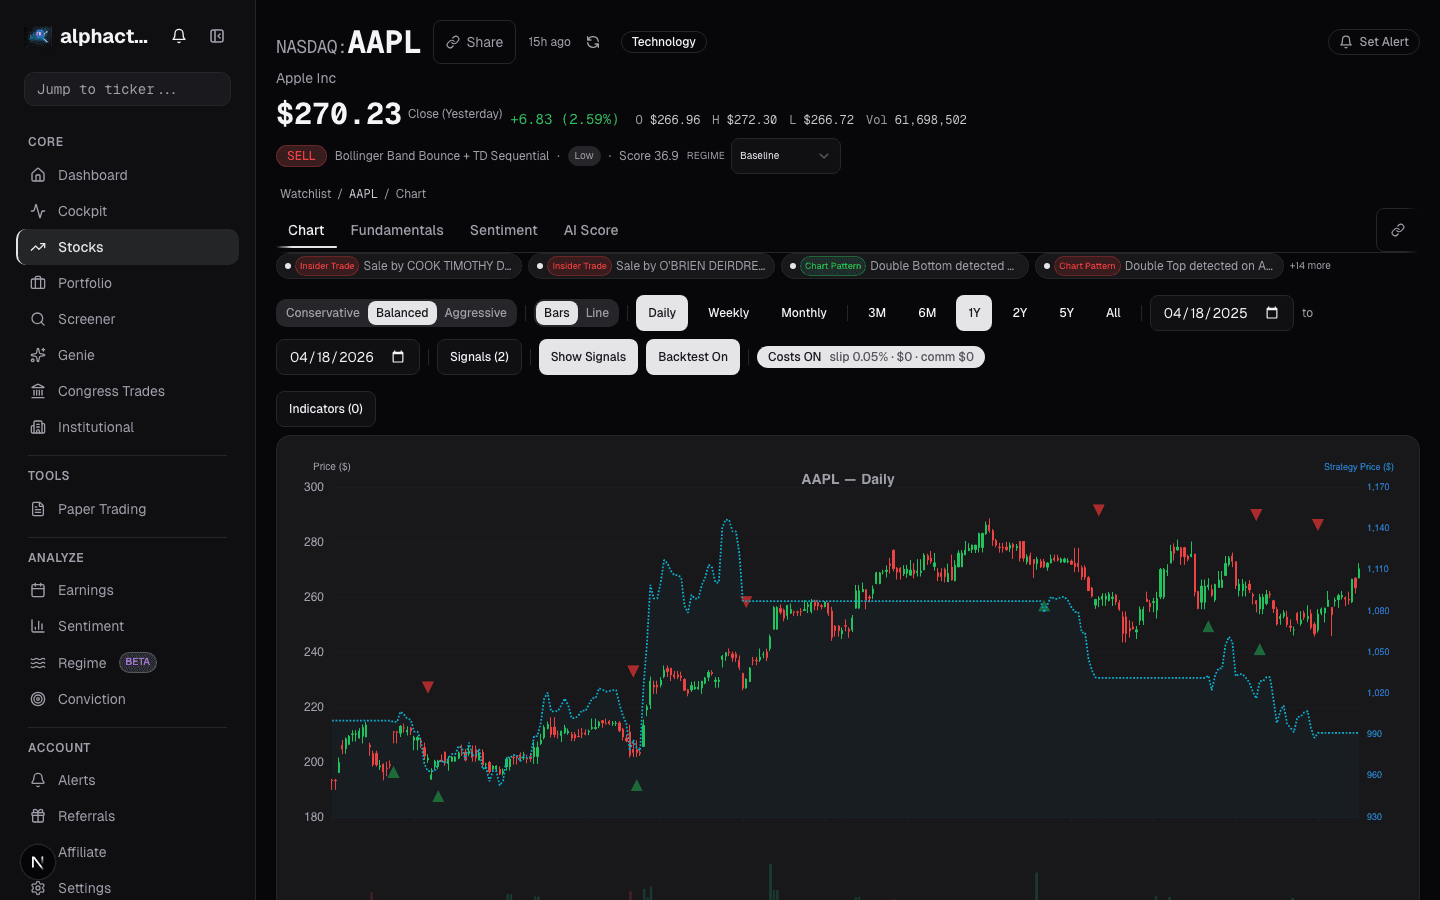
Individual factors work, but they work better in combination. A stock that is cheap (value), trending upward (momentum), and run by a high-quality business (quality) has three tailwinds instead of one. Alphactor's Alphactor backtesting tools let you test multi-factor strategies against historical data to see how combining signals would have performed across different market environments.
The key insight is that no single factor works all the time. Value can lag for years. Momentum can reverse violently. Quality can underperform in speculative manias. But a diversified factor approach smooths the ride and keeps you exposed to the structural drivers of return that have persisted for decades.
See it in the app
Live dashboard views that match this post. Each tile deep-links to the exact card.


Stocks mentioned
Related reading
How to Build a Watchlist That Beats the Headlines
A practical approach to screening stocks, defining what criteria actually matter, and avoiding the FOMO trap of chasing news-driven momentum.
Divergence Trading: The Signal That Saved My Account
How RSI divergence helped me catch a major market top, plus a practical guide to regular and hidden divergences with confirmation techniques.
Dual Momentum: Beating Buy-and-Hold for 40 Years
Gary Antonacci's dual momentum strategy combines absolute and relative momentum to deliver equity-like returns with bond-like drawdowns. Here are the numbers.
Market Regimes: Why One Strategy Can't Do Both
How to identify market regimes using volatility, breadth, and trend data, and why adapting your strategy to the current environment separates consistent…
Sector Rotation Using Momentum: A Rules-Based Approach
A systematic sector rotation strategy using relative momentum on the 11 SPDR sector ETFs, with backtest results and walk-forward validation from 2000 to 2024.
Pairs Trading for Retail Investors: Simpler Than You Think
A practical guide to pairs trading using cointegration, with a worked example on XOM/CVX and backtest results showing how market-neutral strategies reduce…
Ready to try alphactor.ai?
Validate your trading strategies with statistical credibility testing. Start free.
Get Started Free