Divergence Trading: The Signal That Saved My Account
How RSI divergence helped me catch a major market top, plus a practical guide to regular and hidden divergences with confirmation techniques.
 Marcus Chen4 min read
The Trade That Changed Everything
September 2018. I was long a basket of tech stocks, AMZN, NFLX, ADBE, riding what felt like an unstoppable bull run. AMZN had just crossed $2,000 for the first time. Everything looked great on the surface. Price was making higher highs. Moving averages were stacked bullish. The financial news was euphoric.
But RSI was doing something different. On the weekly chart, each new price high in AMZN was met with a lower RSI high. July peak: RSI at 78. August peak: RSI at 71. September peak, when price was even higher: RSI at 64.
Bearish divergence. Price was going up, but momentum was fading.
I did not immediately sell everything. I had been burned before by acting on a single signal. But I tightened my stops and reduced position sizes. When the Q4 2018 selloff hit and AMZN dropped from $2,050 to $1,307 in three months, a 36% decline, I lost some money. But I did not lose my account. That divergence signal was the reason I had risk management in place before the drop.
My first blown account in 2014? I ignored the same type of signal on a smaller stock. Did not know what I was looking at. Lesson learned the expensive way.
What Divergence Actually Is
Divergence is a disagreement between price and an oscillator indicator, usually RSI or MACD. It comes in two flavors.
Regular (classic) divergence signals a potential trend reversal:
- Bearish divergence: Price makes a higher high, but the oscillator makes a lower high. Upward momentum is weakening even though price is still climbing.
- Bullish divergence: Price makes a lower low, but the oscillator makes a higher low. Selling pressure is drying up even though price is still falling.
Hidden divergence signals trend continuation:
- Bullish hidden divergence: Price makes a higher low, but the oscillator makes a lower low. The pullback looks weak on the oscillator, but the uptrend is intact.
- Bearish hidden divergence: Price makes a lower high, but the oscillator makes a higher high. The bounce looks strong on the oscillator, but the downtrend resumes.
Hidden divergence gets less attention, but I have found it equally useful. It helps me time entries on pullbacks within established trends, which is where most of my profits come from.
Why Divergences Work
Divergence works because it measures something price alone cannot tell you: the rate of change in buying or selling pressure. A stock can keep making new highs while the buyers behind each new high are getting weaker and fewer. Eventually, the last buyer buys, and there is nobody left to push price higher.
Think of it like a ball thrown upward. The ball continues rising for a while after the force of the throw has peaked. Divergence detects the throw weakening before the ball starts falling.

This is why divergence signals often appear days or weeks before actual reversals. Momentum deteriorates before price does.
How to Avoid Early Entries
The biggest problem with divergence trading is timing. Divergence can persist for a long time before price finally reverses. I once saw bearish divergence on TSLA persist for nearly two months while the stock rallied another 40%. If I had shorted at the first divergence signal, I would have been destroyed.
My rules for confirmation:
Wait for a trigger candle. Divergence alone is a warning, not a trade. I need a strong bearish candle (for bearish divergence) or a strong bullish candle (for bullish divergence) after the divergence forms. An engulfing pattern or a decisive break of a short-term trendline works.
Check the timeframe. Divergence on a 5-minute chart is noise. On a daily chart, it warrants attention. On a weekly chart, it is a serious signal. The higher the timeframe, the more reliable the divergence.
Look for divergence at key levels. Bearish divergence at a major resistance zone is much more significant than bearish divergence in the middle of nowhere. Same for bullish divergence at established support.
Volume should confirm. If price is making a higher high on declining volume while RSI diverges bearishly, the signal is stronger. Rising price on falling volume and falling momentum is a setup where the rug can get pulled fast.
Spotting Divergences Efficiently
Manually scanning charts for divergence across hundreds of stocks is tedious. I spent years doing it, flipping through watchlists every weekend, squinting at RSI peaks. It works, but it does not scale.
Alphactor's signal engine flags momentum divergences as part of its analysis. When I see a stock with a bearish divergence flag on Alphactor charts combined with a declining conviction score, it tells me the same story my AMZN trade told me in 2018: surface-level strength with eroding internals. That combination has kept me out of several traps.
Putting It All Together
My divergence trading checklist:
- Identify divergence between price and RSI (or MACD histogram) on daily or weekly chart
- Confirm divergence occurs at a significant support or resistance level
- Wait for a trigger candle, do not front-run the signal
- Check volume for confirmation
- Set stop loss beyond the most recent swing high (bearish) or swing low (bullish)
- Take partial profits at the first support/resistance level and trail the rest
Divergence is not a holy grail. It produces false signals, especially in strong trending markets where momentum can stay elevated for longer than you expect. But combined with level-based confirmation and patience, it is one of the few signals that consistently gives you an early warning before major moves. You can set up trade alerts to get notified when divergences form on stocks in your watchlist, so you do not have to scan manually. That AMZN trade was not luck. It was the signal doing exactly what it is supposed to do, and me finally being disciplined enough to listen.
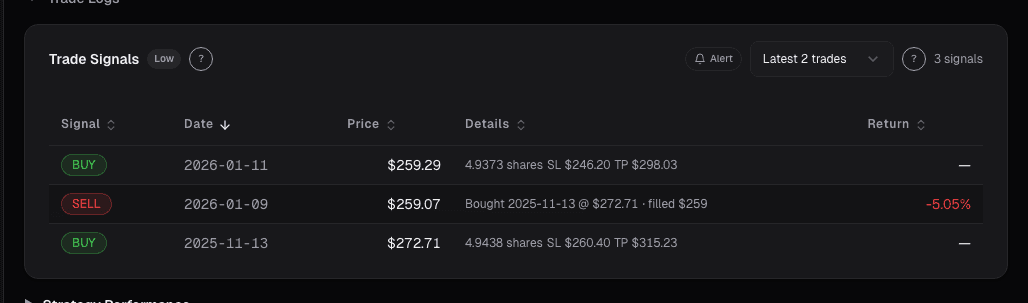
See it in the app
Live dashboard views that match this post. Each tile deep-links to the exact card.


Stocks mentioned
Related reading
ADX: How to Measure Whether a Trend Is Worth Trading
ADX measures trend strength, not direction. Here is how to use it with directional indicators to identify trending markets and avoid costly whipsaws in ranges.
The Bollinger Band Squeeze
Bollinger Band squeezes predict volatility expansions. Here is how to identify them, measure their intensity, and avoid the false breakouts.
Why Stacking 5 Indicators on Your Chart Is Making You Worse
Most traders use too many indicators that say the same thing. Learn how to pick 2-3 complementary indicators and reduce signal noise.
Factor Investing in Plain English
Value, momentum, quality, size, and volatility: the five major investment factors explained without jargon, with practical applications for retail portfolios.
Regime-Aware Strategy Selection
Markets cycle through trends, ranges, and shocks. Learn how regime detection drives which strategy runs, and why a mixture of experts beats a single static…
Risk Management for Retail Portfolios
Practical position sizing, stop-loss strategies, correlation awareness, and drawdown limits for retail investors managing their own money.
Ready to try alphactor.ai?
Validate your trading strategies with statistical credibility testing. Start free.
Get Started Free