Blog /
#indicators
15 posts tagged indicators.
15 posts
Market Breadth: The Health Check Most Investors Skip
How advance-decline lines, new highs-lows, and participation rates reveal whether a rally is built on solid ground or propped up by a handful of stocks.

Divergence Trading: The Signal That Saved My Account
How RSI divergence helped me catch a major market top, plus a practical guide to regular and hidden divergences with confirmation techniques.

Why Stacking 5 Indicators on Your Chart Is Making You Worse
Most traders use too many indicators that say the same thing. Learn how to pick 2-3 complementary indicators and reduce signal noise.
Fibonacci Retracements
An honest look at Fibonacci retracements in trading, why they seem to work, when they actually help, and the 61.8% level's mixed track record.
Ichimoku Cloud: Complicated, but Here's What Matters
A practical breakdown of Ichimoku Cloud trading: which of the five lines actually matter and when simpler indicators do the job just as well.
VWAP: The Institutional Benchmark Retail Traders Overlook
VWAP is the price benchmark institutions use to measure execution quality. Here is why it matters for retail traders and how anchored VWAP extends it to…

ADX: How to Measure Whether a Trend Is Worth Trading
ADX measures trend strength, not direction. Here is how to use it with directional indicators to identify trending markets and avoid costly whipsaws in ranges.

On-Balance Volume: The Simplest Way to Spot Accumulation
OBV tracks whether volume flows into or out of a stock. When OBV diverges from price, someone knows something you do not.
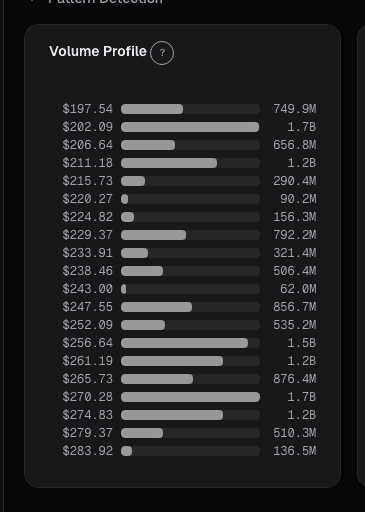
Volume Profile: Where Real Support and Resistance Lives
Price-based support and resistance is a guess. Volume profile shows you where actual transactions occurred and where institutions have real positions to defend.
Stochastic Oscillator: When It Works and When to Ignore It
The stochastic oscillator thrives in ranging markets and fails in trends. Here is how to use ADX to know which regime you are in and when to trust the signal.

ATR for Position Sizing
How Average True Range normalizes risk across stocks, sets intelligent stop losses, and determines position size based on volatility, not gut feeling.
SMA vs EMA vs WMA: Which Moving Average Actually Matters
A practical comparison of simple, exponential, and weighted moving averages with backtested data showing when each type works and when it does not.