Part of: Technical Analysis
Fibonacci Retracements
An honest look at Fibonacci retracements in trading, why they seem to work, when they actually help, and the 61.8% level's mixed track record.
 Jake Morrison4 min read
The Uncomfortable Truth About 1.618
I want to be straight with you about Fibonacci retracements: a significant part of why they "work" is because thousands of traders are staring at the same levels. When NVDA pulls back from a swing high and bounces at the 38.2% retracement, it is tempting to attribute that to some mathematical harmony in market structure. The more honest explanation is that enough traders had buy orders clustered at that level to create the bounce.
That does not make Fibonacci useless. Self-fulfilling prophecies can be traded profitably. If you know where the crowd is looking, you know where liquidity sits. But it does mean you should not treat Fib levels as gospel, and you definitely should not use them in isolation.
How Fibonacci Retracements Actually Work
The core levels are derived from the Fibonacci sequence: 23.6%, 38.2%, 50%, 61.8%, and 78.6%. You draw from a significant low to a significant high (or vice versa) and the tool plots horizontal lines at those percentages of the move.
The theory is that after a strong move, price tends to retrace to one of these levels before continuing. A shallow retracement (23.6% or 38.2%) suggests strong trend momentum. A deeper pullback (61.8% or 78.6%) suggests the trend is weaker and may reverse.
In practice, what I have found over 12 years of trading is this: the levels work best when they align with other forms of support or resistance. A 50% retracement that also coincides with a prior consolidation zone and a rising 50-day moving average? That is a level worth paying attention to. A 38.2% retracement hanging in empty space with no volume profile support? I am skeptical.
The 61.8% Level's Mixed Track Record
The "golden ratio" at 61.8% gets the most attention. It is supposed to be the key level where deep pullbacks find support before the trend resumes. The reality is more nuanced.
I tracked my own trades using 61.8% as an entry level across about 200 trades from 2018 to 2022. The results were mixed. In strong uptrends, stocks like AAPL or AMZN during bull markets, the 61.8% level held roughly 55% of the time. Not bad, but not the high-probability setup that Fibonacci evangelists suggest.
Where 61.8% fell apart consistently was in transitional markets. When a stock was shifting from an uptrend to a range or downtrend, the 61.8% "support" was just a speed bump on the way to a full retracement. I got burned badly on a META trade in 2022 when I bought the 61.8% pullback from the $380 high. It blew through that level like it did not exist, and the stock eventually bottomed near $88.

The lesson: the 61.8% retracement is not a magic support level. It is one data point that needs context.
When Fibonacci Actually Helps
Entry timing on confirmed trends. That is where I have found the most consistent value. If a stock is clearly in an uptrend, making higher highs and higher lows, above its major moving averages, Fibonacci retracements can help you time a pullback entry rather than chasing.
The process I use now:
- Identify a stock in a confirmed uptrend
- Wait for a pullback to begin
- Draw Fibonacci from the swing low to the swing high
- Look for confluence at the 38.2% or 50% level with a moving average or volume node
- Enter only if I see buying pressure develop at that level (a bullish candle, volume spike, or RSI turning up from oversold)
Step five is critical. The Fib level alone is not the trade. The level plus confirmation of demand is the trade.
Confluence Is Everything
The most profitable Fibonacci trades I have taken always had multiple factors lining up at the same level. I am talking about a Fib retracement that also hits a prior resistance-turned-support zone, sits near a rising 20-day EMA, and shows a volume shelf on the profile.
When I run backtests on Alphactor backtesting, I have noticed that signals with price near key Fib levels and confirmed by momentum indicators have notably better outcomes than Fib levels alone. The conviction score tends to be higher when multiple factors align, which makes sense, you are measuring the same thing I learned through painful experience, just with math instead of scar tissue.
How to Avoid the Fibonacci Trap
Do not anchor your entire thesis on a Fib level. I have watched traders draw Fibonacci on every swing, on every timeframe, until their chart is a spider web of horizontal lines. At that point, price is always near some Fib level, which means the tool has told you nothing.
Pick the most significant swing on your trading timeframe. Draw one set of retracements. Look for confluence with other methods. If the confluence is not there, the Fib level is just a number on a chart.
And be honest with yourself about the results. If you track your Fib-based trades and the win rate is not meaningfully better than your other entries, drop it. There is no award for using more tools. The goal is to find what works for your style, test it with real data using Alphactor charts, and keep only what earns its place on your chart.
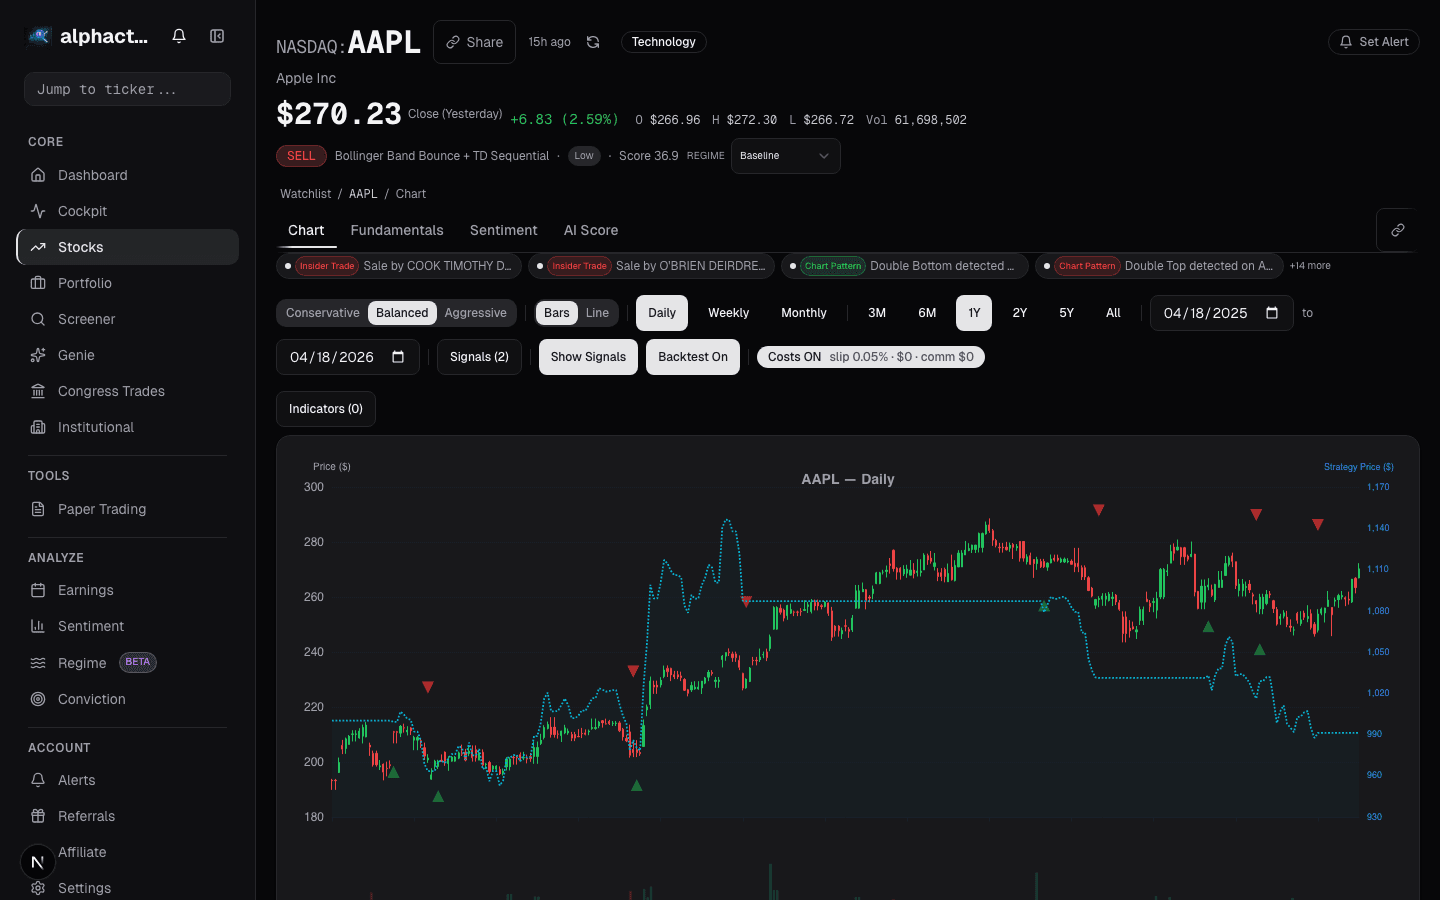
See it in the app
Live dashboard views that match this post. Each tile deep-links to the exact card.


Stocks mentioned
Related reading
ADX: How to Measure Whether a Trend Is Worth Trading
ADX measures trend strength, not direction. Here is how to use it with directional indicators to identify trending markets and avoid costly whipsaws in ranges.
5 Candlestick Patterns With Real Statistical Edge
Most candlestick patterns are noise. Research shows only a handful have measurable predictive power, and context matters more than the pattern itself.
Why Stacking 5 Indicators on Your Chart Is Making You Worse
Most traders use too many indicators that say the same thing. Learn how to pick 2-3 complementary indicators and reduce signal noise.
Ichimoku Cloud: Complicated, but Here's What Matters
A practical breakdown of Ichimoku Cloud trading: which of the five lines actually matter and when simpler indicators do the job just as well.
MACD Beyond Crossovers
The MACD histogram reveals momentum shifts before the signal line cross. Here is how to read it properly and combine it with volume.
SMA vs EMA vs WMA: Which Moving Average Actually Matters
A practical comparison of simple, exponential, and weighted moving averages with backtested data showing when each type works and when it does not.
Ready to try alphactor.ai?
Validate your trading strategies with statistical credibility testing. Start free.
Get Started Free