Technical analysis has a PR problem. A generation of Fibonacci retracements and "head and shoulders" pattern articles poisoned the well. The actual core of technical work, understanding price, volume, trend persistence, and mean reversion as statistical phenomena, has held up remarkably well under rigorous testing. The pattern-naming mysticism has not. This pillar separates the two.
I came to technicals from a quantitative background and I ran every pattern I could find through walk-forward tests. What survived is a surprisingly small toolkit. What did not survive would fill several books. I'll tell you which is which and why.
What technical analysis actually is
Strip away the jargon and technical analysis is three ideas:
- Trends exist. Prices exhibit momentum over multi-week to multi-month horizons that is statistically distinguishable from random walk, documented across global equity markets since Jegadeesh-Titman 1993 and replicated many times since.
- Volume is information. A move on 3× average volume is a different event than the same move on average volume. Volume confirms conviction.
- Price has memory. Levels where a lot of shares previously changed hands act as gravitational features because they sit in the P&L distribution of many holders.
That's it. Everything else, Elliott Waves, Gann angles, candlestick name-magic, is either a repackaging of those three ideas or a coincidence mistaken for a pattern. If a technical indicator can't be explained as an expression of trend, volume, or memory, I treat it as decorative.
Trend: the single biggest edge
The highest-quality technical signal I know of is simply trend persistence. The academic finding is that cross-sectional momentum, ranking stocks by trailing 6- to 12-month returns and going long the top decile, has produced positive, durable excess returns across markets and decades. Time-series momentum (a single asset above vs. below its trailing moving average) has shown similar results.
Practical implementation rules:
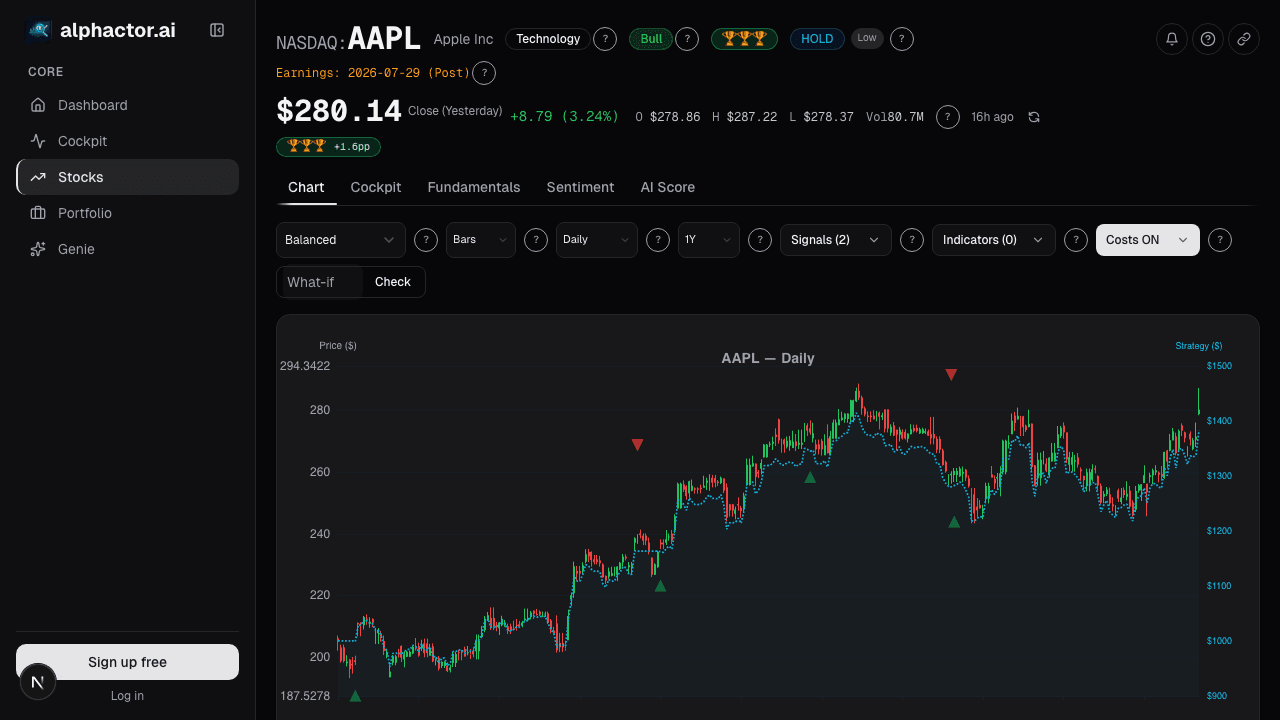
- Use longer-horizon filters. A 200-day moving average is the standard institutional filter. I add a 50-day for a faster confirmation layer. When price is above both and the 50 is above the 200, I'm in an up-trend regime for that name.
- Respect the gap between signal and noise. Daily moving-average crossovers whipsaw you to death on individual names. Weekly data smooths most of the noise and still catches the real trends.
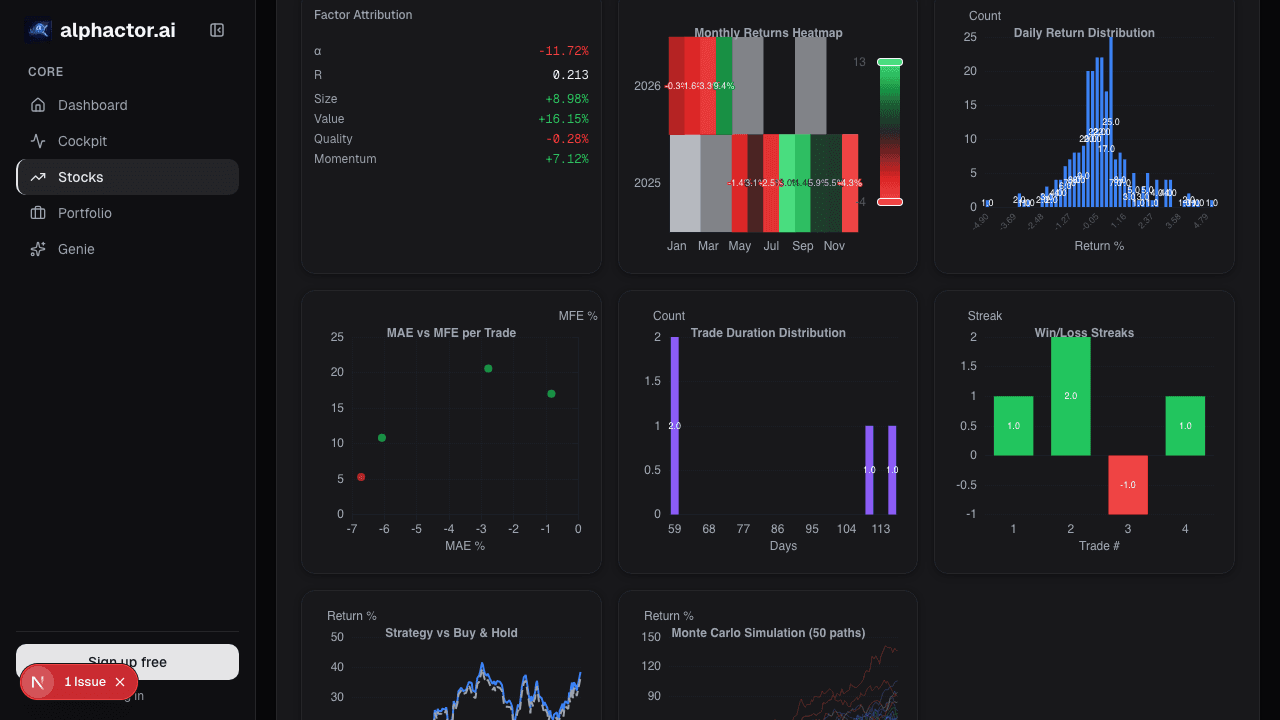
- Combine with volume. A trend on rising volume is stronger than the same price trend on declining volume. I use Moving Averages Chart Overlays with on-balance volume as a cross-check.
- Accept that trend-following has long drawdowns. The strategy's Achilles' heel is whipsaws during range-bound markets. If you can't stomach 20% drawdowns in an otherwise-positive strategy, trend isn't for you.
Volume: the thing most beginners ignore
Volume is the least-photogenic part of technical analysis, which is why retail skips it. It is also the part with the most information-per-pixel on a chart. A few patterns worth knowing:
- Volume dry-ups at support. When a pullback happens on visibly lower volume, that's a sign the sellers have exhausted themselves at that level.
- Volume expansion on breakouts. A breakout from a multi-week base on >2× average volume is a different animal than the same breakout on average volume. The former is directional conviction; the latter is often a head-fake.
- Volume profile as gravity. The Volume Profile Chart Nodes post covers this in detail, but the core idea is that price tends to get attracted to, then resolved past, high-volume nodes. They're the physical evidence of prior supply and demand.
The test I apply to any technical signal: can I restate it in terms of something observable about buyer vs. seller behavior? If yes, it has a shot at being real. If the restatement requires metaphors like "the market is tired" or "sentiment is stretched," I treat it as speculative.
Support and resistance: memory of prior trading
Support and resistance is the most misused concept in technical analysis. The trivial version, draw a line at a recent high or low, is almost useless because those levels are overfit to the eye. The useful version is:
- Prior high-volume price areas. Places where a lot of shares changed hands become zones where current holders have cost basis. Those holders will react when price revisits.
- Round numbers. \$100, \$200, all-time highs. These are psychological anchors, not mystical, but they do cluster decisions.
- Multi-timeframe confluence. A level that is a pivot on the weekly chart AND a volume node on the daily is much stronger than either alone.
The Support and Resistance with Volume post has the specific rules I use for ranking S/R strength. The shortest version: ignore any horizontal line that doesn't have at least two of (volume node, round number, prior pivot).
Indicators I actually use
The indicator menu on most charting platforms has hundreds of options. I use about five. Everything else is either redundant or hasn't beat baseline in my testing.
- Moving averages (50 and 200 period, on weekly data for positioning context, daily for entry timing). Trend regime.
- On-Balance Volume (OBV). Volume direction confirmation.
- Average True Range (ATR). Volatility normalizer for stop placement.
- Volume profile (session and composite). Support/resistance and mean-reversion targets.
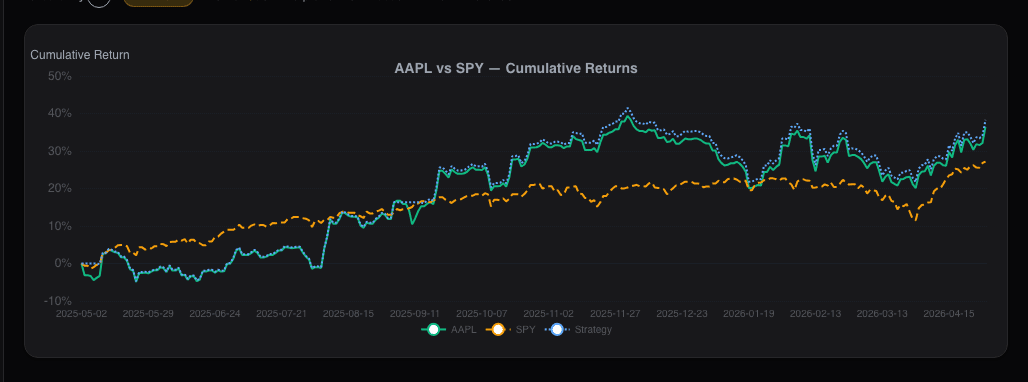
- Relative strength vs. SPY. A name outperforming the index on a rolling 60-day window is exhibiting genuine idiosyncratic demand, not beta-chasing.
Things I've tested and don't use: RSI divergence (noisy on individual stocks), MACD histogram (lagging and redundant with MAs), Bollinger Band squeezes (works occasionally, hasn't beaten ATR-based signals in my tests), Ichimoku (attractive visually, hasn't added measurable alpha on top of MA + volume).
Multi-timeframe analysis
A single chart on a single timeframe is an impoverished view. At minimum I look at three:
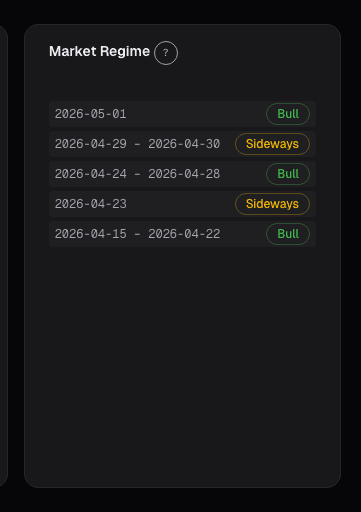
- Weekly. Regime. Am I in an up-trend, a range, or a down-trend?
- Daily. Setup. Is today's tape consistent with initiating in the direction of the weekly regime?
- Hourly or 15-minute. Execution. Where's the actual entry, and where does the thesis break?
A common rookie mistake is to trade a daily chart signal that contradicts the weekly regime. Those trades have much lower expectancy than signals that align with the higher timeframe. I wrote this down as a rule: no counter-weekly trades unless the setup is designed as a mean-reversion trade with a 1-3 day hold.
Example: GOOG in early 2026
In January 2026 GOOG pushed above \$195 on rising weekly volume after a multi-month consolidation. Daily MAs were aligned (50 > 200, price above both). OBV had been rising for six weeks. Relative strength vs. SPY had just crossed the 60-day high. That is a textbook trend-continuation setup. My entry was on the pullback into the \$190 volume node on declining sell volume, classic support retest. Stop was one ATR below the node (\$186). Target was prior resistance at \$210. The trade worked, but more importantly, it was the trade the framework asked for. Every piece of it reduced to trend + volume + memory. No "cup and handle," no Elliott wave count, no lunar phase.
Common mistakes
- Over-layering indicators. A chart with 9 indicators is a chart where 8 are noise. Pick a small set, use it consistently, and get good at it.
- Signal-mining. Running 100 indicator combinations until one back-tests well is not research; it's curve-fitting. Walk-forward or it didn't happen.
- Ignoring the regime. A mean-reversion signal that works in a range-bound regime will lose money in a trending one. You have to know what regime you're in before the signal fires.
- Confusing pattern-naming with pattern-testing. "Head and shoulders" is a label. It is not a tested trading strategy. Every named pattern should be tested with explicit entry, stop, and target rules before you trust it.
- Treating candlestick patterns as standalone signals. A bullish engulfing candle is a weak signal on its own and a reasonable confirmation signal in context. The context is what matters.
- Not accounting for survivorship bias. Any pattern that "always works" on the chart you're looking at probably works because you pulled up the chart in hindsight. Test on the universe, not the anecdote.
FAQ
Can I make money with technical analysis alone?
You can. The trend-following literature is the cleanest example, pure price-based systems have produced durable returns for decades. But the highest-quality retail strategies combine a technical trigger with a fundamental or regime filter. Pure chart trading is higher-variance and requires more discipline than most people credit it.
How much data history do I need before a signal is trustworthy?
For a single-asset system, I want to see at least 10 years of out-of-sample results or 50+ independent trades. For a cross-sectional system, a few thousand observations across the investable universe. Less than that and you're looking at a sample too small to distinguish from noise.
Which timeframe is "best"?
The one that matches your schedule. Day-trade timeframes demand attention you probably don't have if you have a day job. Weekly trend-following asks for ~10 minutes a week. Pick the horizon you can execute consistently, because inconsistent execution kills more technical systems than bad signals do.
Are candlestick patterns worth learning?
A handful are worth knowing as context. Engulfing candles, pin bars, and inside days carry information *in the right setting.* Named multi-candle patterns (morning star, evening star, three soldiers) are weaker signals in modern markets than the literature implies. Learn a small set, don't memorize the textbook.
What about Fibonacci?
The golden ratio does not have predictive power over equity prices. Fibonacci retracement lines often "work" because they are near other meaningful levels (prior pivots, round numbers, moving averages) not because of any mystical relationship. Use the underlying levels directly.