Part of: Technical Analysis
Dashboard Movers: Catching Unusual Moves Before They're Old
Most platform movers lists are dangerous, they rank by % change alone, surfacing illiquid small-caps on meaningless volume.
 Jake Morrison7 min read
Early in my trading career I ran what turned out to be an expensive habit: I'd open a broker's default movers list every morning, pick two or three names from the top gainers, and day-trade them. On the surface the approach seemed reasonable. The list ranked by % change, I'd confirm there was some kind of news, and I'd take short-term momentum positions. After six months my P&L attribution showed a systematic pattern: I was losing money on roughly 65% of the trades, and the losers had something in common, they were names that were already up 40-50% by 9:45 AM on news that had broken pre-market, meaning by the time I was trading them at 10:15 the move had essentially been over for half an hour. The broker's movers list was sorted by % change with no regard for when the move happened, so the top of the list was dominated by names that had already moved and couldn't really move much more. The tradeable setup, a name moving *right now*, on above-average volume, with meaningful ADV, was buried because it was only up 3%, not 28%. I stopped using the platform's default movers list; I built one that sorted on freshness, ADV, and volume Z-score. My win rate recovered to around 55% over the following three months, not dramatically higher, but on much cleaner entries where the move had room to continue.
This post is about the Dashboard Movers card, why most movers lists surface stale trades, and the two filters that turn the list from noise into a scannable candidate set.
TL;DR
- % change alone is useless. Surfaces illiquid names on meaningless volume and stale gap-up trades with no continuation.
- Volume Z-score > 2 filters for institutional participation: a 4% move on 2σ volume is different from a 4% move on flat volume.
- Liquidity floor matters. Names below $5M ADV look tradeable but aren't at size.
- Time-of-day decay ranks fresh moves above stale ones. A 20-minute-old move is actionable; a 3-hour-old move is priced.
- News flag disambiguates: moves without news are often cleaner technical setups; moves with news are headline reactions.
Why most movers lists fail
The default movers list on most platforms sorts by absolute % change. That ranking produces three classes of names at the top, almost all of which are untradeable:
- Illiquid small-caps: a $50M microcap can easily move 15% on $2M of volume, which is nothing. The % change flags it as "mover," but you can't trade it at the size you need.
- Stale gap-up or gap-down moves: names that gapped on pre-market news and have been range-bound since 9:40. They look like big movers at 10:30, but the move happened and is over. Entering at 10:30 is chasing the gap with no continuation.
- Short-squeeze micro-explosions: a 35% intraday move in a heavily-shorted name that's about to unwind in the afternoon as the squeeze runs its course. By the time the mover shows up on screen, the trade is over.
A useful movers list filters all three out:
- Minimum liquidity threshold (ADV > $5M) so everything shown is tradeable
- Volume Z-score on today's pace vs. the 20-day average (so moves on flat or below-average volume are excluded)
- Time-of-day decay (so recent moves rank above stale ones)
This transforms the list from a ranking of "names that have moved the most" to a ranking of "names moving right now in a way that indicates continuation."
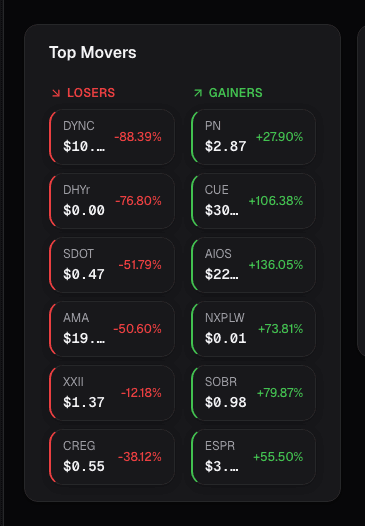
What the Movers card shows
The Movers card on the dashboard ranks intraday gainers and decliners with all three filters applied:
- Minimum ADV filter (default $5M, configurable)
- Volume Z-score vs. 20-day average: only names with Z > 1.5 are shown by default
- Time-of-day decay: moves ranked by a combined (% change × freshness) score, so a 20-minute-old move can rank above an older larger move
- News-existence flag: an indicator showing whether a news headline is associated with the move
- Break-of-range indicator: whether the name has cleared a prior day high/low or significant technical level
- Market-cap tier toggle: large / mid / small, so you can focus on your preferred capitalization band
- Dark-pool activity indicator: whether dark-pool prints are confirming or refuting the lit-market move
Two filters that do most of the work
% move + volume Z-score > 2. A 4% move on 2σ-above-average volume means institutional participation; someone with real size is taking the other side of your potential entry. A 4% move on flat volume is retail noise, the move will often fade within the session. The volume Z-score is the single most important filter for separating tradeable moves from noise. Names that pass this filter consistently have higher same-day continuation rates; names that don't almost always fade.
News flag state. Moves *without* news are often cleaner technical setups, break-of-range with no narrative, which means the move is flow-driven and follows conventional technical expectancies. Moves *with* news require narrative parsing before a position, the headline might already be priced in (sell-the-news), or it might be the first of multiple related items (continuation). Knowing the news state up-front changes how you evaluate the move.
Example: a morning mover workflow
My typical morning routine with the card, in under five minutes:
- Open Movers, market-cap tier = large/mid, filters default (ADV ≥ $5M, volume Z ≥ 1.5).
- Scan the top 10 gainers, top 10 decliners.
- For each name, check: % change (is it extreme?), volume Z-score (is institutional flow real?), time-of-day (is the move fresh?), news flag (is there a narrative?).
- Tag names that show: fresh move (< 30 min), volume Z > 2, no news flag, break-of-range indicator lit. These are the cleanest technical setups, typically 2-4 names on a normal day, 0-1 on a quiet day, 6-8 on an active day.
- For the 2-4 names, open the chart, verify the break-of-range structure, check relative strength vs. sector, size accordingly.
That workflow converts the 20-name movers list into a 2-4 name candidate set that's worth deeper technical work. The filtering out of stale-news-gap names and low-volume illiquid names is what creates the asymmetry, the remaining names are disproportionately ones with real continuation potential.
What the card can't tell you
- Whether the continuation will sustain. The card surfaces candidates; entry/exit sizing is still your job.
- Post-hours flow. The card is intraday-only; extended-hours volume isn't in the ranking.
- Cross-sector rotation. Movers are per-name; the sector context requires the Universe Heatmap or sector-ETF view.
- Options flow context. Movers is lit-market volume; unusual options activity is a separate card.
- The quality of the news. The news flag is binary; interpreting the headline and its durability requires reading it.
Common mistakes
- Trading the biggest movers without volume confirmation. Top of the list by % change is the wrong filter.
- Entering after 2 hours into a move. Late entries have worse asymmetric payoff; the move has already absorbed most of its energy.
- Ignoring the news flag. A news-driven move is a different trade than a clean technical break.
- Using movers as a screening tool. Movers surfaces candidates; the Screener is the tool for fundamental filtering.
- Over-relying on single-day movers. A name that moves 4% today and 4% tomorrow on 2σ volume each day is more interesting than a single-day 10% move.
Where it fits
Movers complements Prediction Heatmap (which updates once daily with next-day forecasts) with intraday flow context. Pair with Recent Alerts, when a name appears on both lists simultaneously, it has both triggered your custom rules *and* shown unusual-volume intraday behavior, which is a high-quality join. For the post-move context on whether dark-pool prints confirm the lit-market move, cross to Dark Pool Prints.
FAQ
How often does the card update?
Every 30 seconds during market hours. Volume Z-scores refresh continuously as today's pace evolves.
Can I adjust the ADV and Z-score thresholds?
Yes, both are user-configurable. I use ADV > $10M and Z > 2 for higher-conviction setups.
What's "break-of-range" mean exactly?
The name has cleared prior-day high or low, or a 10-day trading range. The indicator is lit when the break has occurred within the current session.
Does this work pre-market?
Pre-market is shown as a separate tab. Pre-market movers have their own liquidity considerations, spreads are wide and institutional participation is lower.
Can I customize the sort?
Yes, default sort is the time-decayed-score; you can switch to pure % change, pure volume Z, or custom weighting.
Related reading
Open the Movers card → /app
See it in the app
Live dashboard views that match this post. Each tile deep-links to the exact card.
Stocks mentioned
Related reading
Dark Pool Prints
Off-exchange share above 45% clustered into weakness signals institutional accumulation. Dark pool prints are regulated, post-trade transparent, and measurable.
Market Signals on the Dashboard: Macro Context in One Card
Every stock trade is partially a macro trade whether you want it to be or not. The Market Signals card condenses breadth, volatility, rates, and leadership…
Dashboard News: A Filtered Stream Across Your Holdings
Generic news feeds drown you in noise. The Dashboard News card filters by your holdings and ranks by sentiment impact: what's new, what matters, why.
The Prediction Heatmap
The prediction heatmap encodes probability shifts as color and saturation so you triage your whole watchlist in 30 seconds before opening a single chart.
Recent Alerts on the Dashboard: Your Rule Triggers
Alert fatigue is the silent killer of alert systems. The Recent Alerts card consolidates every rule-driven event into one stream you can triage in five…
User Signals: Your Custom Rules
The durable edge in retail investing is almost always a custom rule, a specific combination of factors nobody else is screening for the same way.
Ready to try alphactor.ai?
Validate your trading strategies with statistical credibility testing. Start free.
Get Started Free