Market Signals on the Dashboard: Macro Context in One Card
Every stock trade is partially a macro trade whether you want it to be or not. The Market Signals card condenses breadth, volatility, rates, and leadership…
 Marcus Chen7 min read
In February 2020 I watched a trader make three perfectly reasonable bullish trades over four days. Each one had a clean setup, oversold bounce, earnings beat, sector rotation thesis. Each one was stopped out in the next 72 hours. He wasn't wrong about the stocks. He was wrong about the tape. Breadth had been deteriorating for two weeks, the HY/IG ratio had cracked, and the VIX was curling up from a compressed base. In isolation, each of those was a yellow flag; in combination, they were red. None of his charts told him that, because his workflow went straight from dashboard to single-name without a macro check. That is the most common process error I see in traders who are otherwise technically competent.
This post is about the Market Signals card, the handful of composite patterns that matter, and how to make a 30-second macro check a habit so your single-name trades stop running into regime headwinds you didn't see.
TL;DR
- Every stock trade is partially a macro trade. The same setup works in one regime and fails in another.
- Check breadth and credit together. SPY up with breadth down and HY/IG falling = narrow rally, usually reverts.
- VIX and rates together matter more than either alone. Falling both = risk-on; falling VIX with rising rates = late-cycle melt-up.
- Sector leadership rotation is a 2–3 week lead indicator. Defensives taking leadership from cyclicals usually precedes broader de-risking.
- 30 seconds is enough. The card is a triage layer, not a research surface.
Why you check breadth before names
A single-stock trade is never only a single-stock trade. The stock sits inside a sector, the sector inside a style (growth/value, large/small), the style inside the market, and the market inside a regime. The same bullish setup on a mid-cap works in a tape with improving breadth and fails in a tape with deteriorating breadth. A moderately bearish technical setup resolves gently in a rate-cutting cycle and violently in a tightening one. If your trading workflow jumps from "I like this chart" directly to "buy," you are implicitly assuming the tape is neutral, and that assumption is wrong far more often than it's right.
The 30-second macro check isn't research. It's a triage layer: is the tape hostile, neutral, or friendly to what I'm about to do? If hostile, tighten sizing or wait. If neutral, proceed. If friendly, consider scaling up a touch. That's the entire value. The card isn't there to make you a macro investor; it's there to save you from trading into macro headwinds you didn't check for.
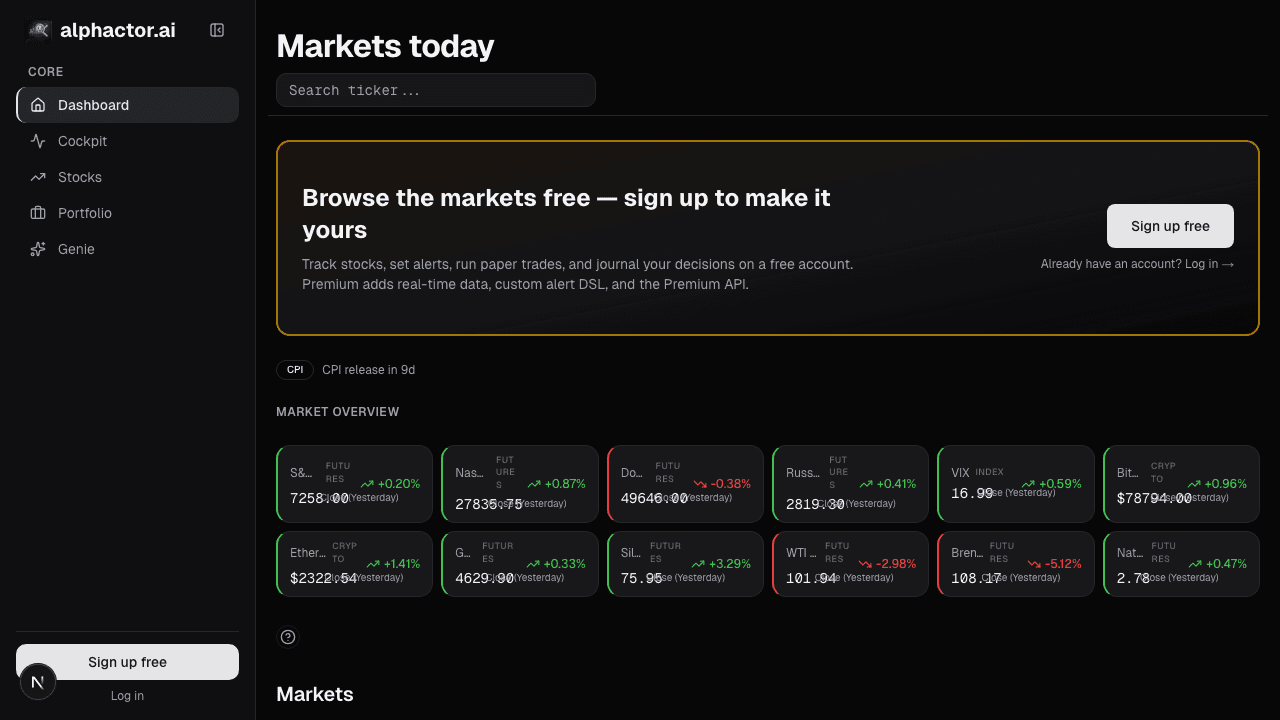
What the Market Signals card shows
The Market Signals card summarizes eight indicators updated intraday:
- Advance/Decline breadth: trailing 5-day cumulative A/D on the S&P 500
- New highs vs. new lows: NYSE + NASDAQ aggregated
- VIX: current level and 20-day change
- 10-year yield: current level and 20-day change
- Sector leadership: which sectors are leading or lagging equal-weight on trailing 20 days
- Dollar index (DXY): for the global-flow check
- HYG/IEI ratio: high-yield vs. investment-grade bond ETFs, a credit-risk proxy
- Gold: safe-haven / inflation proxy
Each row shows current value, a sparkline, and a red/green/yellow state flag based on cross-indicator thresholds. A composite "tape state" at the top of the card combines breadth, credit, and vol into a single label: risk-on, risk-neutral, risk-off, or transitioning.
Three composite patterns that matter
Breadth plus credit confirms or disputes the index. The simplest and most actionable pattern. When SPY is up but trailing-5-day breadth is negative and HYG/IEI is falling, the rally is narrow, a handful of mega-caps carrying the index while the average stock is drifting lower. Narrow rallies almost always revert toward the breadth line. The inverse works too: SPY flat while breadth is positive and HYG/IEI is rising usually precedes a grind higher as the broader tape catches up.
VIX and rates together classify the regime. Falling VIX plus falling rates is the conventional risk-on setup, money flowing out of safe-havens into risk assets. Falling VIX plus *rising* rates is the late-cycle melt-up: risk assets rallying while rate policy tightens. That configuration historically ends sharply, often on a single macro catalyst. Rising VIX plus falling rates is the risk-off mirror, money fleeing risk into duration. Each configuration calls for a different portfolio posture, and the Market Signals card shows both variables next to each other for exactly that reason.
Sector leadership rotation leads the broader move. When defensives (Staples, Utilities, Health Care) take over leadership from cyclicals (Tech, Discretionary, Financials) on a trailing 20-day basis, there is historically a 2–3 week lead before broader de-risking shows up in the index. The inverse holds for cyclicals taking leadership from defensives. This is not a perfect rule, there are counter-examples, but the base rate is strong enough to be a meaningful yellow flag. If you're about to enter long positions and defensives have just flipped to leadership, tighten stops or size smaller.
What doesn't matter as much as people think
- VIX level in isolation. A VIX of 15 says little without context. VIX's 20-day change is more informative than its absolute level.
- Any single sector's absolute performance for one day. Daily moves are noisy; trailing 20-day rotation is what matters.
- Gold in isolation. Gold is a weak indicator on its own but informative as a corroborator, rising gold + rising bonds + falling dollar is a stronger risk-off signal than any of them alone.
- Dollar direction. Unless you're trading multinationals or EM exposure heavily, DXY is background, not foreground.
Example: a 30-second check that saved a trade
Last September I was about to add to a tech position that had pulled back to what looked like textbook support. The setup was clean on the single-name chart. Before pulling the trigger I checked Market Signals:
- Breadth: negative for 8 consecutive sessions (yellow)
- New highs vs. lows: lows had taken the lead three days earlier (yellow)
- VIX: up 35% in 10 days (red)
- HYG/IEI: rolling over, down 1.5% in the same window (red)
- Sector leadership: Staples and Utilities had quietly taken over from Tech on a 20-day basis (yellow-red)
Three reds, two yellows, zero greens. That's not a "wait for better setup," that's a "don't add, consider trimming." I skipped the add. Over the next two weeks the tech position traded down another 11% with the tape. The single-name chart had given me a valid bullish signal in isolation; the macro context told me it was the wrong time to act on it. The 30-second check cost me an entry I didn't need.
Common mistakes
- Skipping the check when you're in a hurry. The hurry is the risk. If you're rushing into a trade, that's the most important time to slow down for 30 seconds.
- Over-interpreting a single indicator. Individual indicators are noisy. The value is in the cross-indicator pattern.
- Treating macro signals as entry signals. They're filters, not triggers. The macro tape doesn't tell you what to buy; it tells you how much of your plan to execute.
- Using macro tone as an excuse. "The tape is bad" can become a reason to avoid taking any trade; that's overcorrection. Hostile tape means tighter sizing, not zero.
- Never re-checking intraday. On volatile days, the tape state can shift in hours. Mid-day re-check is cheap.
Where it fits
Market Signals is the macro context layer for the rest of the dashboard. Pair with Cockpit Overview for the event stream, Prediction Heatmap for the probability shifts, and Movers for the intraday outliers. For deeper macro regime work, use the Regime Overview page.
FAQ
How often is the card updated?
Intraday, approximately every 5 minutes during U.S. market hours. Breadth and HYG/IEI update with their underlying feeds; sector leadership recomputes every 15 minutes.
Is the composite "tape state" a trade signal?
No. It's a regime classifier. Risk-on tapes have higher base rates for long-side setups; risk-off tapes have lower base rates. Use it to size and pace, not to enter.
What if the indicators disagree?
That's usually the transitioning state, the card will label it as such. Transitioning tapes are harder to trade; I typically reduce activity during them until the indicators converge.
Can I customize the indicator set?
Yes, the card supports adding a 9th and 10th user-chosen indicator from a menu that includes SKEW, TRIN, Put/Call ratio, and the AAII sentiment survey. I leave the defaults in place because they've proven robust.
Does this replace a macro newsletter or research service?
No, it's complementary. The card gives you the tape state; deeper macro research gives you the *why*. The tape state is what you need in 30 seconds before a trade; the *why* is what you need weekly for portfolio positioning.
Related reading
- Dashboard Movers & Unusual Volume
- Dashboard News Stream
- Dashboard Prediction Heatmap
- Dashboard Recent Alerts
Open the Market Signals card → /app
See it in the app
Live dashboard views that match this post. Each tile deep-links to the exact card.

Related reading
Dashboard Movers: Catching Unusual Moves Before They're Old
Most platform movers lists are dangerous, they rank by % change alone, surfacing illiquid small-caps on meaningless volume.
Dashboard News: A Filtered Stream Across Your Holdings
Generic news feeds drown you in noise. The Dashboard News card filters by your holdings and ranks by sentiment impact: what's new, what matters, why.
The Prediction Heatmap
The prediction heatmap encodes probability shifts as color and saturation so you triage your whole watchlist in 30 seconds before opening a single chart.
Recent Alerts on the Dashboard: Your Rule Triggers
Alert fatigue is the silent killer of alert systems. The Recent Alerts card consolidates every rule-driven event into one stream you can triage in five…
User Signals: Your Custom Rules
The durable edge in retail investing is almost always a custom rule, a specific combination of factors nobody else is screening for the same way.
Watchlist on the Dashboard
Your watchlist should be a live tape, not a to-do list. The Watchlist card on the dashboard pulls price, sentiment, signals, and alerts into one per-row…
Ready to try alphactor.ai?
Validate your trading strategies with statistical credibility testing. Start free.
Get Started Free