The Prediction Heatmap
The prediction heatmap encodes probability shifts as color and saturation so you triage your whole watchlist in 30 seconds before opening a single chart.
 Marcus Chen6 min read
The single most common mistake I see in morning workflows is spending too much time in list view. A watchlist with 20 names, each with 6 columns of data, is 120 data points to process before you know where to focus. At 3 seconds per data point that's a six-minute triage before you've even opened a chart. A heatmap compresses the same information into a single visual scan of 30 seconds, and your pattern-recognition brain is genuinely better at reading colors than at reading numbers. The heatmap isn't a replacement for the list; it's the triage layer that tells you which list rows are worth examining.
This post is about the Prediction Heatmap card, how the colors encode information, and the patterns worth recognizing when you scan it each morning.
TL;DR
- Lists are for analysis; heatmaps are for triage. Use the heatmap first.
- Hue = direction (red bearish, green bullish). Saturation = confidence. Washed-out cells are low-conviction regardless of hue.
- Blocks of same-color cells signal macro/sector moves. Color checker patterns signal idiosyncratic dispersion.
- Saturated cells in an otherwise washed-out sector are the "look at me first" signal.
- The heatmap is a prompt, not a trade signal. It tells you where to look, not what to do.
One screen, every ticker
Your dashboard has a job: answer *what changed overnight?* in 30 seconds. A list of names with columnar data is the wrong tool for that job. Your eye has to parse each ticker, pull context, rank by attention-worthiness. At 20 names and 6 columns, that's 120 data points, which overwhelms the 30-second budget.
A heatmap does the job visually. Each cell is a ticker. The cell's color encodes two things: *direction* via hue (red for bearish shift, green for bullish), and *confidence* via saturation (strong colors for high-confidence, washed-out for low). You scan once. The saturated cells stand out. The desaturated ones fade into the background. The cells that are neither hot nor cold (near-zero shifts) are gray. Your brain picks out the worth-looking-at cells in a second or two, and you drill in from there.
This isn't a new idea, the heatmap format has been used for portfolio visualization for decades, but the specific combination of *predictive probability shifts* and *watchlist-scoped rendering* is what makes it useful for morning triage rather than just pretty visualization.
What the Prediction Heatmap shows
The Prediction Heatmap card renders a grid of your watchlist + portfolio tickers, colored by the model's next-5-day directional probability delta vs. the prior day:
- Hue: red = bearish shift (probability of up-move decreased), green = bullish shift (probability of up-move increased)
- Saturation: strength of the shift (high saturation = big shift, low = small)
- Cell label: ticker symbol and the absolute probability value (not the delta) if you want the specific number
- Click: opens the per-ticker view with full details
- Tab row at the top of the card: Probability (default), Regime Change (binary, did the regime flag flip?), News Impact (did stories meaningfully shift probability?), and Flat (no heat, just names, for when the color encoding isn't what you want)
The default probability view is usually right. The regime-change and news-impact views are useful when you want to answer more specific questions, e.g. "which positions are seeing a regime flip" vs. "which are seeing news-driven re-rating."
Reading the colors
Two mental models get the most mileage.
Blocks of same-color cells. When an entire sector glows the same direction, the move is macro or sector-driven, not name-specific. A red block across all your tech names overnight means something happened to the tech sector or to risk appetite broadly. Your book's *exposure to that sector* matters more than any individual name in the block. Rather than drilling into the top name, check the Market Signals card and your aggregate sector weighting. The heatmap is telling you the problem is positioning, not name selection.
Saturated cells embedded in washed-out rows. A single deep-green cell in a sector where everything else is gray or pale is the "idiosyncratic signal" pattern. The sector isn't moving, but one stock in it is. That's usually either (a) a name-specific news event or (b) a model-specific signal change that deserves a look. The cells that stand out from their neighborhood are the ones that reward drill-in, more than the cells that are riding a group move.
The inverse pattern, a deep-red cell in an otherwise green neighborhood, is often more actionable than a green cell in a red neighborhood, because isolated bearish signals in risk-on environments are less common and typically news-driven.
The tabs and when to use them
- Probability tab (default). The general triage view. Use first.
- Regime Change tab. When you want to know which names have just crossed a regime threshold (trending to mean-reverting, or vice versa). Useful for reviewing names you trade based on regime-specific strategies.
- News Impact tab. When you want to filter for names where *news flow* specifically drove the probability shift, rather than price action or factor moves. Useful on mornings when you know there was overnight news and want to see which positions are affected.
- Flat tab. When you want the list without the color encoding. I use this less often, but it's there when color is a distraction (e.g. you're on a tiny screen and the visual encoding doesn't render well).
Example: a Tuesday morning triage
A random Tuesday last November. I opened the Prediction Heatmap and saw:
- A block of 6 red cells across my tech/semiconductor exposures, medium saturation
- One very saturated red cell on a small-cap biotech I own
- Two saturated green cells on energy names in my watchlist
- Everything else washed out to gray
The tech red block told me: macro risk-off overnight, my aggregate semi/tech exposure matters more than any individual name. Checked Market Signals, yes, VIX up 12%, breadth weak. No single-name action on those; just noted the sector drawdown.
The biotech red cell was idiosyncratic, the rest of my healthcare exposure was pale gray. Drilled in: overnight adverse trial data had hit the wire. That was the 10-minute deep-read of the day.
The green energy cells were unusual in a broader risk-off morning. Drilled in: oil was up 3% on overnight geopolitics. Noted as an addition candidate if my energy weight was under target.
Total triage time: under 2 minutes. The list view of the same information would have taken 10.
Common mistakes
- Skipping the heatmap and going straight to the list. You're doing the 6-minute scan instead of the 30-second one.
- Over-interpreting a single cell's hue. Individual cells are noisy; the pattern across cells is where the signal lives.
- Acting on cells without drilling in. The heatmap is a triage prompt. Treating it as a trade signal is a category error.
- Ignoring saturation. A vivid red cell means something; a pale red cell often means almost nothing. Saturation is as important as hue.
- Using only the probability tab. The regime-change and news-impact tabs surface different information, rotate through them weekly at least.
Where it fits
The heatmap lives on the dashboard root alongside Cockpit Overview, Market Signals, Movers, and Recent Alerts. Use the heatmap to pick which cell to drill into, then go to that ticker's chart, sentiment, or fundamentals pages for source material.
FAQ
What exactly is the "probability" the heatmap encodes?
The model's next-5-day directional probability, specifically, the probability that the 5-day forward return is positive. Delta is today's value minus yesterday's.
How accurate is the underlying model?
Historically around 54–58% directional accuracy on a 5-day horizon, above coin flip, below the threshold where it's an auto-trade signal. The value is in aggregation and prioritization, not in any single prediction.
Can I resize the grid or change what tickers appear?
Yes, the card respects your watchlist + portfolio composition. Add a ticker to either and it appears. The card auto-sizes; no manual grid configuration.
Why do most cells look gray most days?
Most days, most tickers have small probability shifts. Gray is the honest encoding. The card is designed so that only the cells with meaningful shifts stand out.
Can I export the heatmap data?
Yes, CSV export includes ticker, current probability, previous probability, delta, regime state, and news-impact flag per row.
Related reading
- Dashboard Market Signals
- Dashboard Movers & Unusual Volume
- Dashboard News Stream
- Dashboard Recent Alerts
Open the Prediction Heatmap → /app
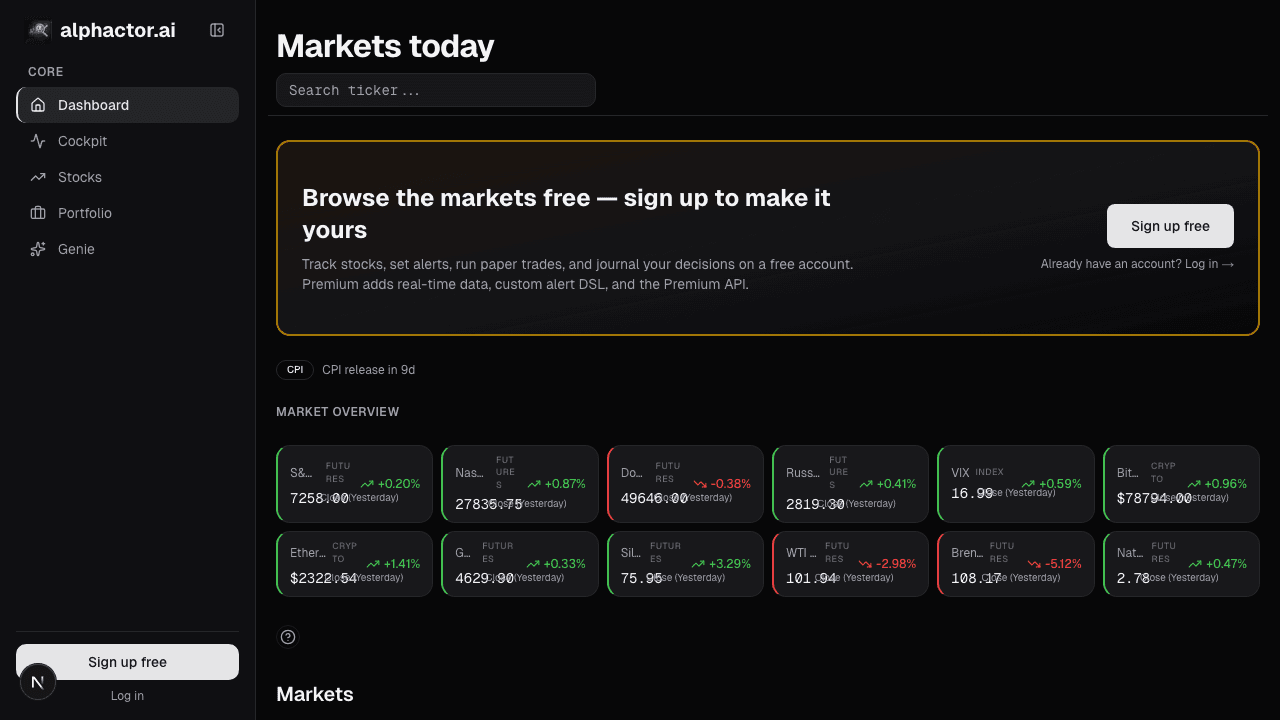
See it in the app
Live dashboard views that match this post. Each tile deep-links to the exact card.
Stocks mentioned
Related reading
Market Signals on the Dashboard: Macro Context in One Card
Every stock trade is partially a macro trade whether you want it to be or not. The Market Signals card condenses breadth, volatility, rates, and leadership…
Dashboard Movers: Catching Unusual Moves Before They're Old
Most platform movers lists are dangerous, they rank by % change alone, surfacing illiquid small-caps on meaningless volume.
Dashboard News: A Filtered Stream Across Your Holdings
Generic news feeds drown you in noise. The Dashboard News card filters by your holdings and ranks by sentiment impact: what's new, what matters, why.
Recent Alerts on the Dashboard: Your Rule Triggers
Alert fatigue is the silent killer of alert systems. The Recent Alerts card consolidates every rule-driven event into one stream you can triage in five…
User Signals: Your Custom Rules
The durable edge in retail investing is almost always a custom rule, a specific combination of factors nobody else is screening for the same way.
Watchlist on the Dashboard
Your watchlist should be a live tape, not a to-do list. The Watchlist card on the dashboard pulls price, sentiment, signals, and alerts into one per-row…
Ready to try alphactor.ai?
Validate your trading strategies with statistical credibility testing. Start free.
Get Started Free