Part of: Technical Analysis
Market Regime on the Chart
Regimes change discretely, but regime models detect them in near-real-time. The Market Regime overlay annotates where the regime flipped so you can see…
 Jake Morrison7 min read
In early February 2022 I took a clean breakout long in a semiconductor name, prior-day high was cleared on above-average volume, relative strength was intact against the Nasdaq, everything that had worked in 2020-21 was pattern-matching. I sized for a normal momentum trade (1.5R). The position stopped out three sessions later; over the following four weeks the same setup kept appearing across names and kept failing at roughly 60% frequency, compared to the ~35% failure rate I'd tracked through 2020-21. What I missed wasn't the chart; what I missed was that the tape had quietly shifted from a low-volatility uptrend regime to a high-volatility correction regime around January 5, and the breakout strategy that had edge in the prior regime had negative expectancy in the new one. By the time I noticed the regime change empirically, from my own P&L degradation, I'd given back six weeks of prior-year gains. A regime-overlay on the chart would have flagged the transition the day it happened.
This post is about the Market Regime chart overlay, why regime-awareness is what separates winning strategies from identical-looking losing ones, and the three reads that make the overlay tradeable rather than decorative.
TL;DR
- Regimes change discretely. The same setup has 70% hit rate in trending regimes and 45% in chop. Pretending otherwise is expensive.
- Regime overlays annotate the chart with the detected state so your trade's context is visible, not inferred.
- Confidence matters more than the label. Act decisively only when regime confidence > 0.75; otherwise size down.
- Transitions often lead style rotations by 2-4 weeks: regime shifts precede sector leadership changes more often than not.
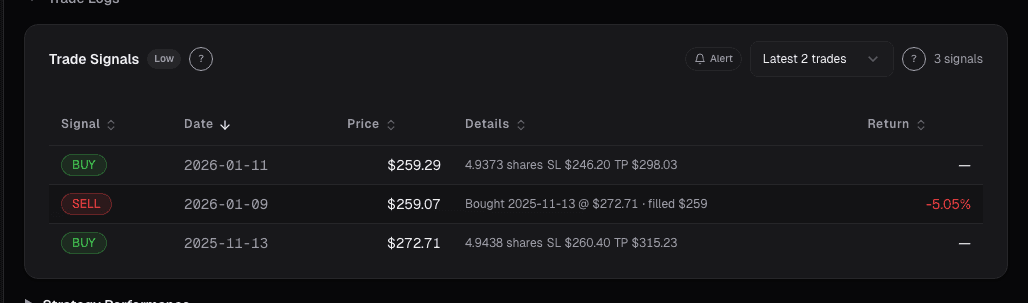
- Pair the overlay with the trade logic: regime-aware entries filter out setups that only worked in the prior regime.
Regime is the missing context on most charts
A technical setup doesn't have a fixed win rate, it has a win rate conditional on regime. Momentum breakouts crush it in low-vol trending-up tapes and bleed in high-vol corrections. Mean-reversion trades are the opposite: they print in chop and get steamrolled in trends. The charts look identical; the outcomes are not.
The problem is that regime is rarely visible on the price chart itself. You can look at a 20-day moving average and a VIX print and *guess* at the regime, but by the time the shift is obvious in price, the damage has been done. A well-calibrated regime classifier, typically a hidden Markov model over volatility, breadth, and cross-sectional dispersion, labels the current bar in near-real-time, and plotting those labels as shaded bands turns the chart from "price-only" into "price-in-context."
The overlay doesn't tell you whether to take the trade. It tells you whether the trade you're about to take has historically worked in the regime you're in.
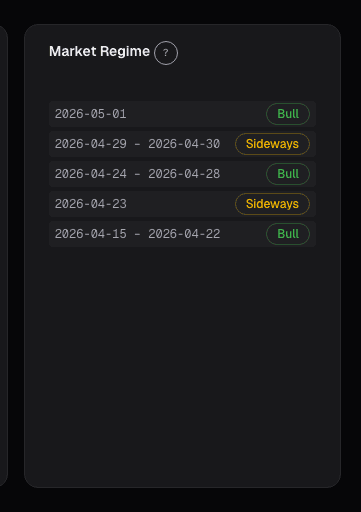
What the Market Regime card shows
The Market Regime chart overlay annotates the price chart with shaded bands representing the detected regime at each bar:
- Four canonical states: low-vol trending up, high-vol correction, range-bound / chop, trending down
- Confidence score per-bar (0 to 1), uncertain regions are hatched rather than solidly shaded
- Transition markers: vertical lines at points where the regime flipped, with the prior/new labels
- Trailing 90-day regime histogram showing how much of the recent past was spent in each state
- SPY regime comparison: the broader-market regime underneath the ticker-specific regime, for cases where single-name and market regime diverge
Reading the overlay
Trade setups inherit regime expectancy. A breakout in low-vol trending regime has a ~70% follow-through rate at my own base; the same breakout in chop has ~45%. Your specific win rates will differ but the delta is stable. Before taking any technical setup, glance at the regime shading behind it. If the regime is the one your setup was built for, proceed at normal size. If the regime is one where your setup has worse expectancy, halve the size or pass.
Confidence is a risk modulator. A regime label at 0.85 confidence means the model is highly certain; act on that label. A label at 0.55 means the model sees mixed signals; the regime is transitioning or chop between two defined states. Hatched (low-confidence) bands are the ones where discretion matters most, not because the label is wrong, but because the thing labeled may not behave like a classical instance of it.
Transitions lead style rotations. A regime flip from low-vol-up to high-vol-correction typically precedes a style shift (growth out, value/defensives in) by 2-4 weeks. If you're watching the cross-sectional leader list for rotation clues, regime transitions are the earliest visible trigger. Don't wait for the rotation to be obvious in sector ETFs; the regime overlay saw it first.
Example: the January 2022 shift
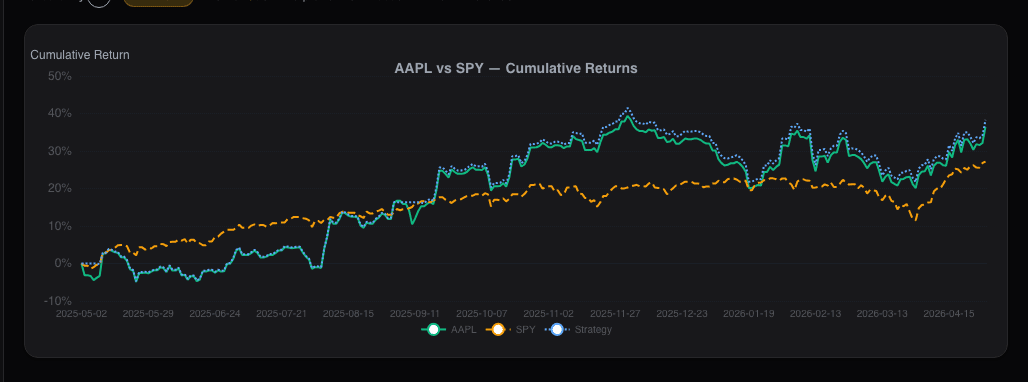
Replayed over SPY with the regime overlay visible:
- Dec 27, 2021 → Jan 4, 2022: regime = low-vol trending up, confidence 0.82
- Jan 5, 2022: regime transition to high-vol correction, confidence 0.71
- Jan 10-14, 2022: confidence rises to 0.88 as NDX breaks 20-day MA
- Jan 21, 2022: NDX down 10% from peak; regime label has been "high-vol correction" for 16 trading days
The regime flip on Jan 5 was the warning. Every momentum breakout after that point was fighting the regime. Had I filtered my breakout longs on "regime = low-vol-up, confidence > 0.75" I'd have skipped most of the February trades that stopped out. The regime didn't predict the decline, it annotated that the market had already entered a state where my strategy doesn't have edge. That's enough.
What the overlay can miss
- Novel regimes. The classifier was trained on historical regimes; a genuinely new market state (e.g., the first weeks of a COVID-style shock) may not map cleanly to any of the four labels. Watch for sustained low-confidence stretches, they signal regime ambiguity.
- Single-name divergence. A stock can be in its own mini-regime that differs from the market (e.g., post-earnings gap with idiosyncratic flow). The SPY-regime underlay helps you spot when the single-name context disagrees with the market context.
- Transition timing precision. The classifier updates daily; within-day regime shifts aren't labeled at intraday resolution.
- Black-swan volatility spikes. A one-day VIX spike may trigger a regime label the model then walks back. Sustained regime labels (3+ days at the same state) are more trustworthy than single-bar changes.
Common mistakes
- Treating the label as deterministic. The label is a probabilistic best-guess; pair it with the confidence score.
- Ignoring regime for mean-reversion trades too. Mean-reversion has regime-dependence same as momentum; it just prefers the opposite regimes.
- Overtrading the transition. Transitions aren't trade signals themselves, they're context for the setups you're already evaluating.
- Not updating strategy parameters by regime. Using the same stop, size, and target across regimes is leaving expectancy on the table.
- Assuming the market regime applies to all names. Small-caps and micro-caps often have their own regime structure that diverges from SPY.
Where it fits
Pair the chart overlay with the full Regime Overview for the cross-sector macro view and Regime Correlations to see how correlations shift by regime (typically correlations spike in corrections and compress in trends). On the single-ticker side, combine with Trade Signals so the entry logic can filter by regime, and with Volatility for the vol-of-vol context regime transitions depend on.
FAQ
How is the regime labeled: supervised or unsupervised?
Hybrid. The HMM is unsupervised over features (vol, breadth, dispersion); the four states are post-hoc labeled by their empirical characteristics. The labeling is stable across retrainings.
How often does the classifier update?
Daily, after the close. Intraday regime changes aren't flagged at bar-level resolution.
Does regime apply to single tickers or only to the index?
Both. The overlay shows the ticker-specific regime (using the ticker's own vol and dispersion profile) with the SPY regime underneath. Divergences between them are informative.
Can I backtest strategies filtered by regime?
Yes, the Advanced Chart supports per-regime backtests via the Strategy Builder. A typical setup: same strategy, two versions, one filtered to "regime = low-vol-up," one unfiltered, to measure the regime-filter's contribution to expectancy.
What if the regime is "chop" most of the time?
It often is, ranges dominate. The implication is that most of the time, momentum strategies have negative expected value; running them undiscriminatingly is expensive. The overlay tells you when to run them.
Related reading
- Chart Advanced Analytics
- Chart Benchmark Relative Strength
- Chart News Annotations
- Regime-Aware Strategy Selection
Open the Market Regime overlay → /app/stocks/AAPL/chart
See it in the app
Live dashboard views that match this post. Each tile deep-links to the exact card.
Stocks mentioned
Related reading
Advanced Chart Analytics: Autocorrelation, Seasonality
Beyond moving averages and RSI lives a deeper layer of statistical diagnostics. Hurst exponent, autocorrelation, and seasonality tell you which strategies…
Chart Benchmark: Relative Strength Is Where the Alpha Lives
Absolute price charts hide what's tradeable. Plotting a stock as a ratio against SPY, its sector, or a peer group reveals the idiosyncratic alpha that…
News Annotations on the Chart: Tying Headlines to the Tape
A price move without a reason is just a squiggle you'll misread later. The News card annotates the chart with material headlines at their exact publication…
How Fed Policy Actually Affects Your Stock Portfolio
A practical guide to understanding how interest rate decisions, quantitative tightening, and Fed communication move equity markets at the sector and stock…
Industrial Stocks: Betting on the Real Economy
How industrial stocks track economic growth, the leading indicators that predict their performance, and a framework for investing across the industrial…
Regime-Aware Strategy Selection
Markets cycle through trends, ranges, and shocks. Learn how regime detection drives which strategy runs, and why a mixture of experts beats a single static…
Ready to try alphactor.ai?
Validate your trading strategies with statistical credibility testing. Start free.
Get Started Free