Blog /
#chart
4 posts tagged chart.
4 posts
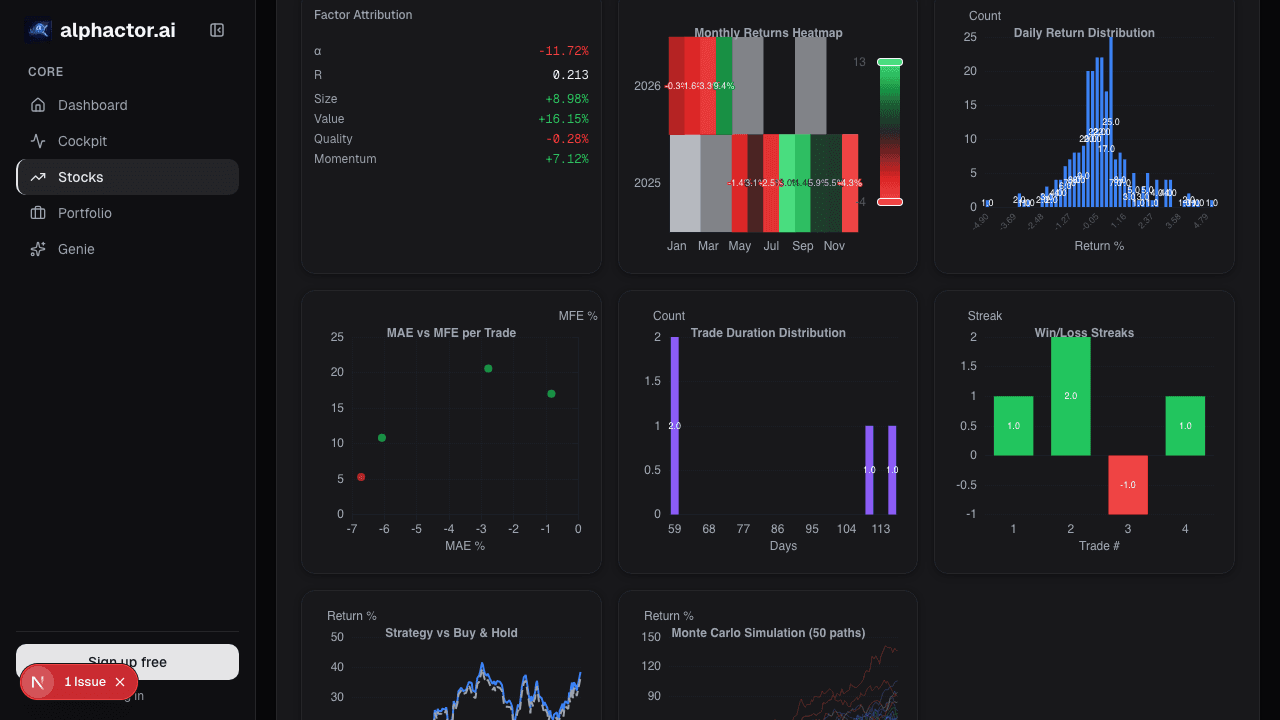
Advanced Chart Analytics: Autocorrelation, Seasonality
Beyond moving averages and RSI lives a deeper layer of statistical diagnostics. Hurst exponent, autocorrelation, and seasonality tell you which strategies…
#analytics#autocorrelation#chart
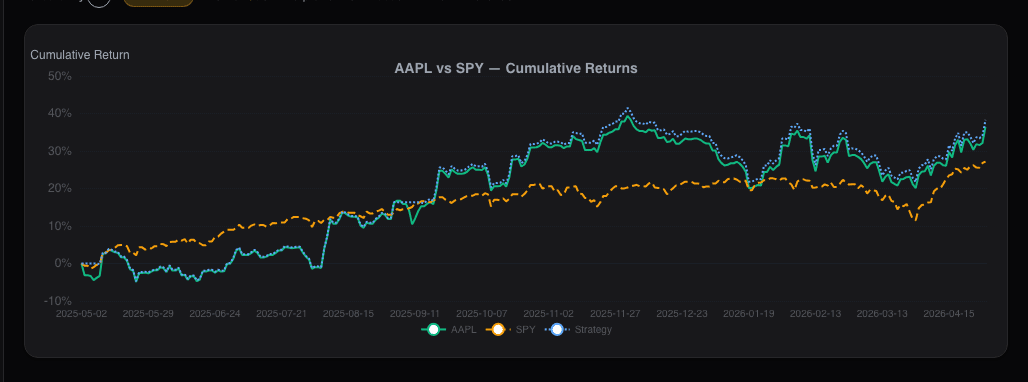
Chart Benchmark: Relative Strength Is Where the Alpha Lives
Absolute price charts hide what's tradeable. Plotting a stock as a ratio against SPY, its sector, or a peer group reveals the idiosyncratic alpha that…
#benchmark#relative-strength#chart
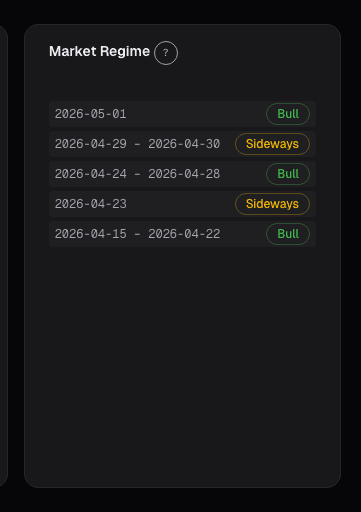
Market Regime on the Chart
Regimes change discretely, but regime models detect them in near-real-time. The Market Regime overlay annotates where the regime flipped so you can see…
#regime#chart#macro
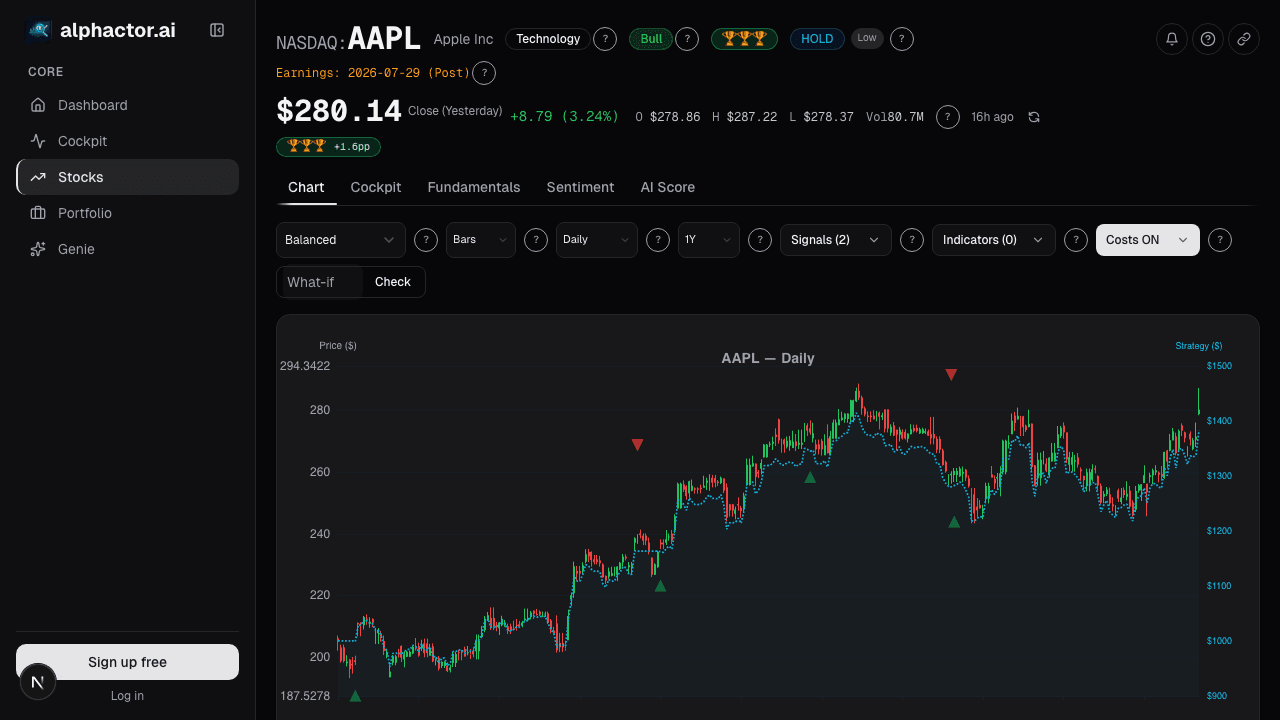
News Annotations on the Chart: Tying Headlines to the Tape
A price move without a reason is just a squiggle you'll misread later. The News card annotates the chart with material headlines at their exact publication…
#news#chart