How Fed Policy Actually Affects Your Stock Portfolio
A practical guide to understanding how interest rate decisions, quantitative tightening, and Fed communication move equity markets at the sector and stock…
 Marcus Chen4 min read
The Most Important Price in the World
When the Federal Reserve raised the federal funds rate from near zero to 5.25% between March 2022 and July 2023, the S&P 500 experienced its worst start to a year since 1970, growth stocks cratered, and the entire venture capital ecosystem seized up. Then, with rates still elevated, the market rallied 24% in 2023 and another 23% in 2024.
The relationship between Fed policy and stock prices is real, powerful, and far more nuanced than "rates up, stocks down." Understanding the transmission mechanism, rather than just the headline rate decision, is what separates informed investors from those who panic-sell on every hawkish press conference.
The Discount Rate Channel
The most direct link between interest rates and stock prices runs through valuation math. A stock's price is theoretically the present value of all future cash flows, discounted at a rate that reflects the risk-free rate plus a risk premium. When the Fed raises rates, the discount rate rises, and the present value of future cash flows falls.
This effect is asymmetric. Companies whose value is concentrated in distant future cash flows (early-stage growth companies, speculative tech, pre-revenue biotech) are far more sensitive to rate changes than companies generating large near-term cash flows (mature value stocks, utilities, consumer staples).
This is precisely why the Nasdaq fell 33% in 2022 while the Dow Jones, weighted toward banks, industrials, and healthcare, fell only 9%. Same rate cycle, radically different outcomes based on where cash flows sit on the timeline.
The Liquidity Channel
Beyond the discount rate, the Fed influences how much money is sloshing around the financial system. Quantitative easing (buying bonds) injects reserves into the banking system, lowers long-term yields, and pushes investors into riskier assets. Quantitative tightening (letting bonds roll off) does the opposite.
Between 2020 and 2022, the Fed's balance sheet expanded from $4 trillion to nearly $9 trillion. That flood of liquidity inflated everything from meme stocks to NFTs. The subsequent tightening, which shrank the balance sheet by over $1 trillion, coincided with the collapse of speculative assets.
For investors, monitoring the pace of balance sheet changes is as important as watching the funds rate. A Fed that is cutting rates but also draining liquidity through quantitative tightening sends a more ambiguous signal than headlines suggest.
The Credit Channel
Rate policy flows through the banking system into corporate credit conditions. Higher rates increase borrowing costs for companies that rely on variable-rate debt or need to refinance. This hits small caps disproportionately: roughly 40% of Russell 2000 debt is floating-rate, compared to under 10% for the S&P 500.
During the 2022-2023 tightening cycle, small-cap stocks significantly underperformed large caps partly because their interest expense surged while mega-cap tech companies, sitting on massive cash piles, were actually earning more interest income. Apple alone was generating over $1 billion per quarter in interest on its cash holdings.
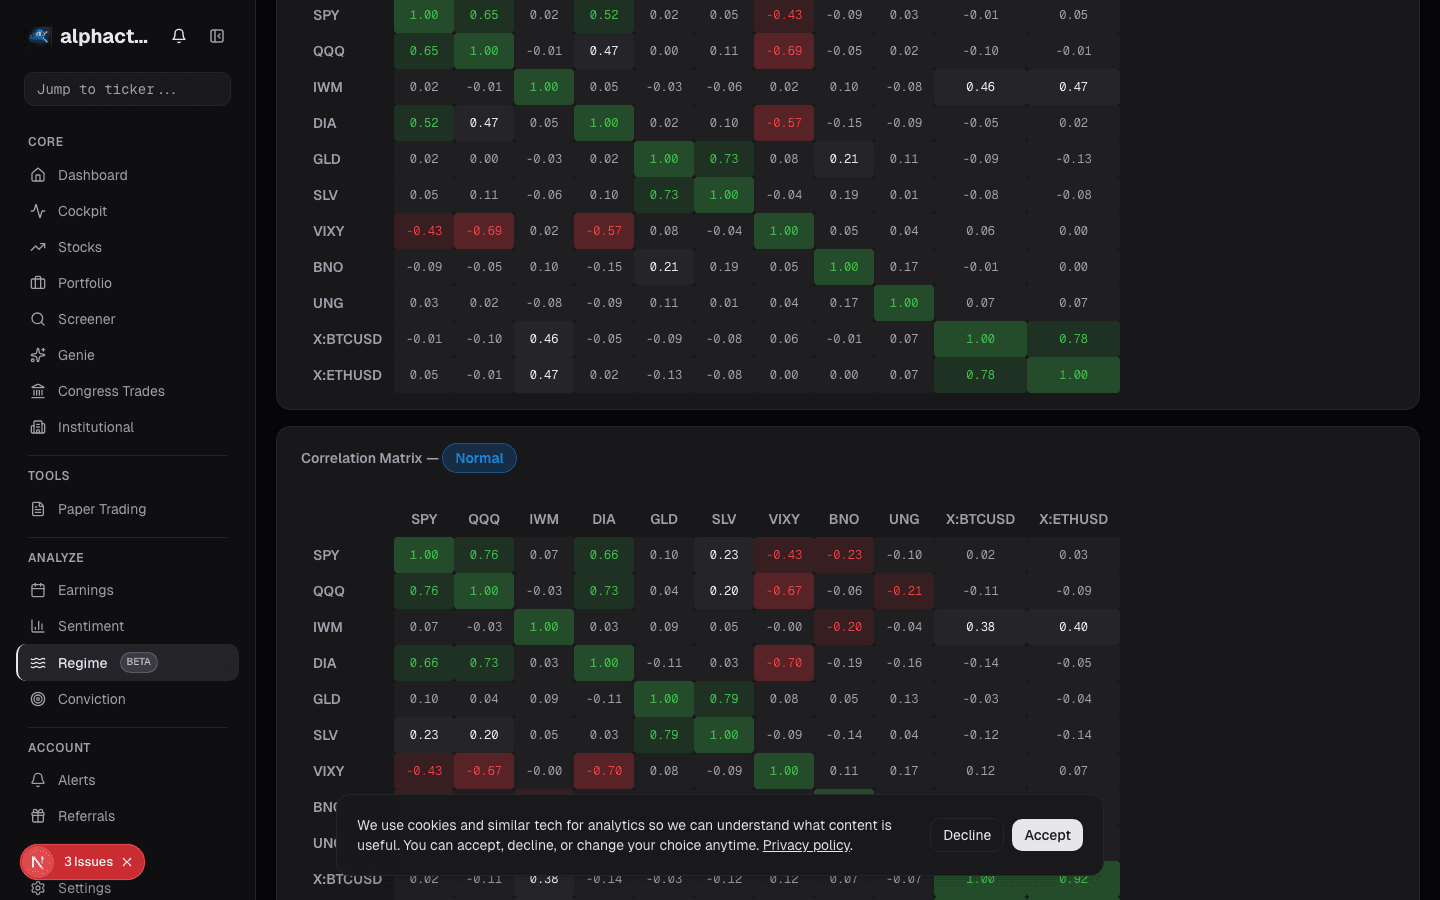
This is why rate cuts tend to benefit small caps more than large caps, and why the market's reaction to the first rate cut of a new easing cycle often shows up most dramatically in the Russell 2000. The universe scanner lets you compare how different market-cap segments respond to changing rate expectations.
The Forward Guidance Channel
Since Ben Bernanke formalized forward guidance in 2012, the Fed's words have moved markets as much as its actions. The stock market prices in expected rate changes months in advance through the federal funds futures market. By the time a rate decision is announced, it is almost always already priced in.
What moves markets on decision day is the deviation between the announcement and expectations: the dot plot shifting higher or lower than anticipated, the statement language changing from "some" to "further" tightening, or the press conference tone shifting from cautious to confident.
This is why you can see the market rally on a rate hike (if fewer future hikes are signaled) or sell off on a rate cut (if the statement suggests it is a one-and-done move). The level of rates matters less than the expected trajectory.
Positioning Around Fed Events
The practical approach is not to predict what the Fed will do, which professional forecasters fail at routinely, but to understand how your portfolio is positioned for different outcomes.
Check your duration exposure. If you are concentrated in long-duration growth stocks, you have an implicit bet that rates will fall or stay stable. Your portfolio dashboard can reveal whether your holdings are clustered in rate-sensitive sectors. Diversify across the spectrum: own some short-duration value alongside long-duration growth, some floating-rate beneficiaries (banks) alongside fixed-rate borrowers (utilities and REITs).
Watch the two-year Treasury yield. It is the market's best real-time estimate of where the Fed is heading over the next 24 months. When the two-year moves sharply, the equity market follows, usually with a lag that creates a window for positioning.
The Fed is a force, like gravity, that you must account for. The investors who perform best across rate cycles understand the transmission channels and position accordingly, rather than reacting to headlines.
See it in the app
Live dashboard views that match this post. Each tile deep-links to the exact card.


Related reading
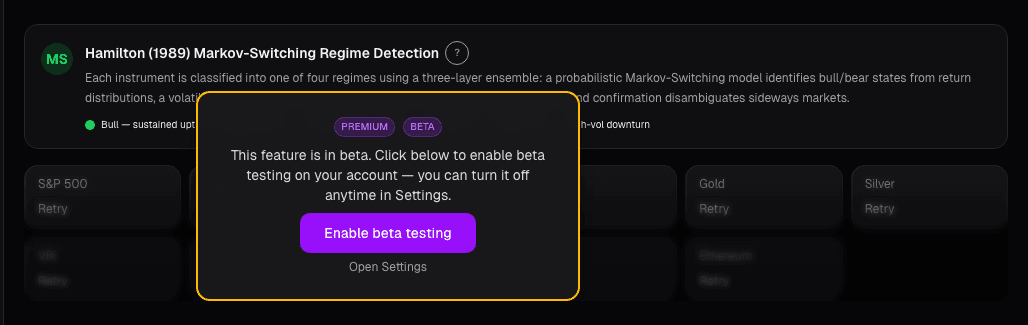
Market Regime on the Chart
Regimes change discretely, but regime models detect them in near-real-time. The Market Regime overlay annotates where the regime flipped so you can see…
Dark Pool Activity: Reading the Institutional Order Flow
What dark pools are, why institutions use them, and how tracking dark pool prints and volume can reveal where smart money is positioning before it shows up…
How Earnings Season Actually Moves Markets
Why the market's reaction to earnings reports depends on guidance, positioning, and expectations far more than the headline EPS number.
Industrial Stocks: Betting on the Real Economy
How industrial stocks track economic growth, the leading indicators that predict their performance, and a framework for investing across the industrial…
Stock Market Seasonality: Which Calendar Effects Still Work?
An evidence-based look at the January effect, sell-in-May, the Santa Claus rally, and other seasonal patterns, separating the ones that still hold from…
Ready to try alphactor.ai?
Validate your trading strategies with statistical credibility testing. Start free.
Get Started Free