Dark Pool Activity: Reading the Institutional Order Flow
What dark pools are, why institutions use them, and how tracking dark pool prints and volume can reveal where smart money is positioning before it shows up…
 Marcus Chen4 min read
The Orders You Cannot See
In early 2023, while Tesla shares were trading sideways between $170 and $200, dark pool data showed a persistent pattern: large block prints accumulating at the lower end of the range, with significantly above-average volume. Retail traders watching the public order book saw nothing unusual. But the dark pool activity, visible only through post-trade reporting data, suggested institutional buyers were steadily building positions. Tesla broke out above $200 in late May and rallied to $270 by July.
This is the value proposition of dark pool analysis. Roughly 40% of all U.S. equity volume now executes in dark pools, up from around 15% a decade ago. These off-exchange venues were designed to let institutions trade large blocks without tipping their hand to the market. But because trades must be reported within 10 seconds of execution, the footprints are visible to anyone who knows where to look.
How Dark Pools Work
A dark pool is a private exchange where buyers and sellers execute trades without displaying orders on the public book. When Fidelity wants to buy 2 million shares of Microsoft for a pension client, posting that on the NYSE would move the price against them. Instead, they route to a dark pool where the order is matched without broadcasting intent.
The key difference: no pre-trade transparency. You see prints only after execution, when trades are reported to the FINRA Trade Reporting Facility. Major operators include Citadel Connect, Virtu Financial, UBS ATS, and Morgan Stanley's MS Pool, each serving the same purpose: letting large participants trade without immediate market impact.
What the Data Reveals
Dark pool data becomes useful when you track three dimensions: volume, price level, and direction.
Volume relative to average: When dark pool volume surges to double or triple its 30-day average, institutions are actively repositioning. This can precede earnings, M&A activity, index additions, or fundamental reassessments. A sudden increase on a quiet stock is a meaningful signal.
Price-weighted prints: Dark pool trades execute near the midpoint of the national best bid and offer. Clusters of large prints near the ask suggest buyers paying up with urgency. Prints near the bid suggest sellers accepting lower prices. The aggregate lean over a multi-day window reveals whether institutions are net buying or selling.
Block trades: Prints of 10,000 shares or more in mid and large-cap stocks represent genuine institutional activity, as opposed to smaller prints that may reflect retail flow routed through wholesalers.
The Short Sale Volume Signal
FINRA publishes daily short sale volume data for dark pools. When short sale volume as a percentage of total dark pool volume rises above 60% for a given stock, there is a common misconception that this is bearish. In reality, dark pool short selling often represents market makers providing liquidity, shorting stock to fill institutional buy orders before covering later.
The more useful signal is the change in short volume. A sudden spike in dark pool short volume combined with declining price and rising overall volume is more likely to represent genuine directional shorting. A spike in short volume with rising price often means market makers are struggling to fill large buy orders, which is actually bullish.
Context matters enormously. Raw dark pool short volume without price and total volume context is misleading, and many retail traders draw the wrong conclusions from it.
Dark Pool Data as a Confirmation Tool
The most practical use of dark pool data is as a confirmation layer on top of your existing analysis. If your fundamental analysis says a stock is undervalued, your technical setup is constructive, and dark pool data shows persistent above-average buying activity with block prints clustering near the ask, you have three independent signals pointing the same direction.
Conversely, if a stock is rallying on light public volume but dark pool data shows heavy selling and large prints near the bid, the rally may lack institutional sponsorship and could reverse.
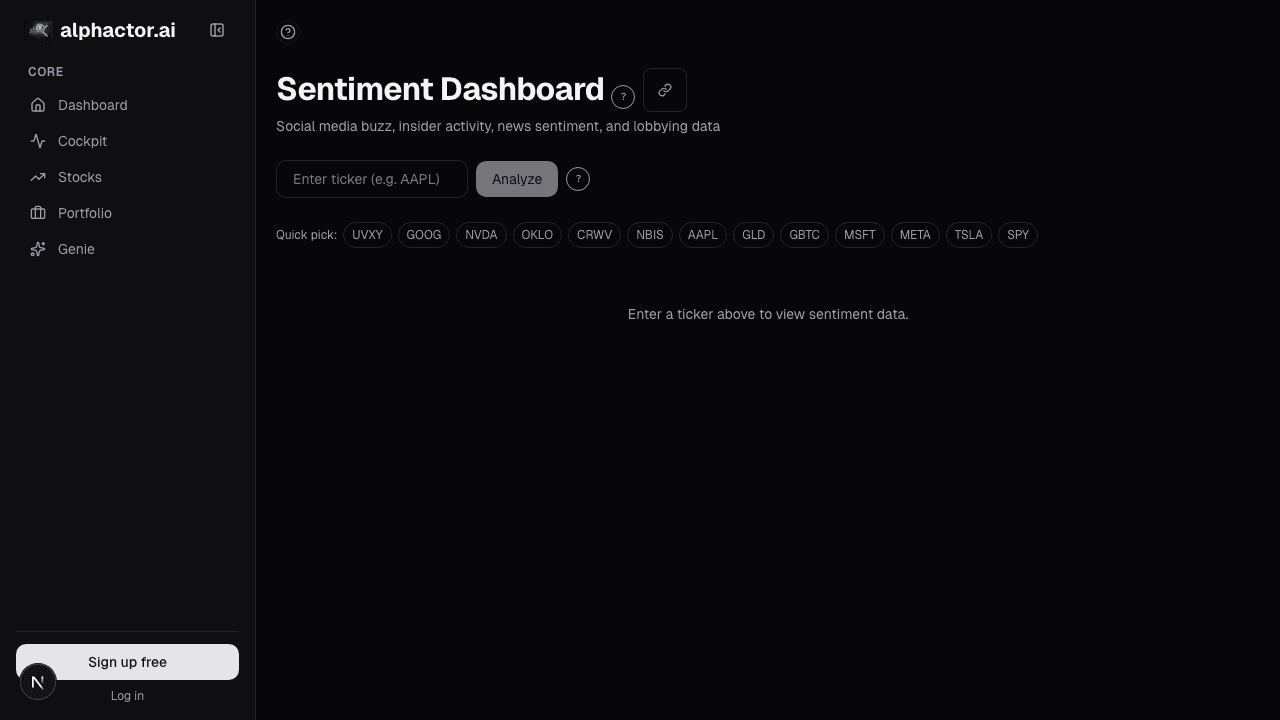
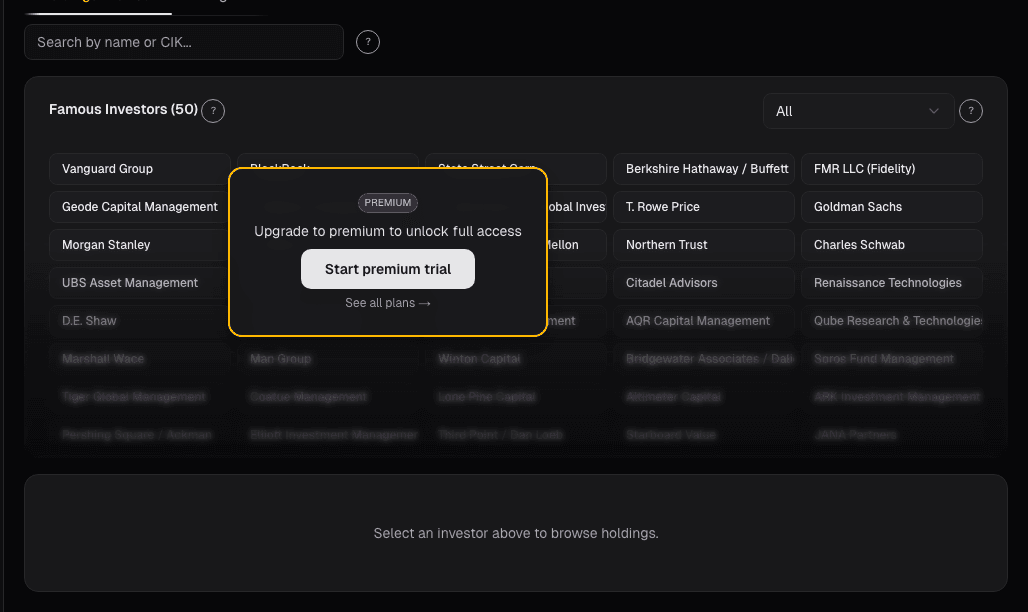
The sentiment dashboard incorporates dark pool flow data, helping you identify when smart money is quietly building or exiting positions in stocks you follow. Pairing this with the 13F explorer gives you both the what (which stocks are seeing unusual dark pool activity) and the where (how institutional holders are positioned at a fundamental level).

Limitations and Pitfalls
Dark pool data has real limitations. You see trades after they happen, not before, so the information advantage is narrow. Not all dark pool volume is informed; a significant portion represents passive index fund rebalancing with no directional signal. Single prints mean very little. Patterns across multiple days and multiple prints are where the signal lives.
As dark pool analytics have become more accessible, some of the edge has been arbitraged. The informational advantage has narrowed but not disappeared, particularly in mid-cap and small-cap stocks where activity is less widely monitored. The universe scanner surfaces these less-watched names where dark pool signals still carry weight. The investors who use this data most effectively treat it as one input among many. When it confirms a thesis built on fundamentals, technicals, and sentiment, it adds conviction. When it contradicts, it demands investigation.
See it in the app
Live dashboard views that match this post. Each tile deep-links to the exact card.


Related reading
Dark Pool Prints
Off-exchange share above 45% clustered into weakness signals institutional accumulation. Dark pool prints are regulated, post-trade transparent, and measurable.
How Fed Policy Actually Affects Your Stock Portfolio
A practical guide to understanding how interest rate decisions, quantitative tightening, and Fed communication move equity markets at the sector and stock…
13F Holders: Who Owns This Stock
Raw ownership is already in the price. What isn't is portfolio-weight change, when a concentrated fund lifts a position from 1% to 4% of its book, that's a…
Market Breadth: The Health Check Most Investors Skip
How advance-decline lines, new highs-lows, and participation rates reveal whether a rally is built on solid ground or propped up by a handful of stocks.
LP Report: Institutional-Grade Portfolio Summaries
Reporting is the tax on managing other people's money. A good LP report system takes a 12-hour manual job and turns it into a 90-minute review-and-polish…
Stock Market Seasonality: Which Calendar Effects Still Work?
An evidence-based look at the January effect, sell-in-May, the Santa Claus rally, and other seasonal patterns, separating the ones that still hold from…
Ready to try alphactor.ai?
Validate your trading strategies with statistical credibility testing. Start free.
Get Started Free