Part of: Risk Management
LP Report: Institutional-Grade Portfolio Summaries
Reporting is the tax on managing other people's money. A good LP report system takes a 12-hour manual job and turns it into a 90-minute review-and-polish…
 Marcus Chen7 min read
The first LP report I ever wrote took me three days. I was running a small fund, the quarter had ended, and I didn't have any of the templates, standards, or supporting infrastructure that larger shops use. I spent the first day assembling returns from broker statements. The second day building attribution in Excel. The third day writing commentary that would have taken an hour if I'd had the underlying numbers ready to go. The report was fine. The process was wildly inefficient. Over the subsequent years I watched friends at other small funds burn the same 3-day lump of time each quarter, out of the belief that "LPs expect us to work hard on this." LPs don't expect that. They expect the report to be right, complete, on time, and readable. How you get there doesn't matter to them.
This post is about the LP Report card, how I use it to compress quarterly reporting into a single afternoon, and the three pieces of discipline that make the automation actually work rather than looking like a generated document.
TL;DR
- LPs evaluate reports on content, not effort. You get no extra credit for manual assembly.
- A good automated system handles 80% of the assembly. The remaining 20%, narrative, exception commentary, outlook, is where the PM actually adds value.
- Include attribution even if you don't talk to it. Institutional LPs expect to see it; missing it signals under-rigorous operations.
- Version every export. The LP-report archive is part of your audit trail.
- Read your output aloud before sending. AI-drafted commentary has specific tells that LPs notice.
Reporting is the tax on managing other people's money
Managing external capital under an RIA or LP structure comes with reporting obligations that scale with AUM but especially with the number of distinct LPs. A single-LP fund owes a report quarterly; a thirty-LP fund owes thirty copies of essentially the same report, each with slightly different customization. Even a sub-$500M manager can spend 40–60 hours a quarter on report assembly, review, and distribution, a full work-week that nobody's paying for directly.
The obvious response is to automate. But automation done badly produces reports that read like they were generated by a machine: boilerplate commentary, no insight, no evidence of a thinking PM behind the numbers. LPs notice. Good automation instead handles the mechanical work, return calculations, attribution, risk metrics, positioning tables, and gives the PM time to focus on the commentary and exception narrative that actually distinguishes the report. The right split is 80/20: 80% machine-generated structure, 20% PM-authored insight.
What the LP Report card shows
The LP Report card generates a configurable quarterly or monthly report with these sections, each populated from the portfolio's live data:
- Cover page: fund name, reporting period, AUM, LP recipient (per LP when exports are personalized)
- Performance table: gross and net returns for MTD, QTD, YTD, 1Y, 3Y, 5Y, SI, with benchmark comparison
- Attribution breakdown: return decomposition by sector, factor, and position
- Top contributors and detractors: top 5 of each for the reporting period, with a one-line driver for each
- Risk metrics: volatility, beta to benchmark, tracking error, max drawdown, Sharpe and Sortino
- Positioning snapshot: current sector and geographic allocation, concentration metrics, net vs. gross exposure
- Narrative block: editable commentary; AI-drafts a first pass from the underlying data, PM rewrites
- Appendix: full position list, trade activity for the period, compliance event log
Exports go to PDF with fund branding applied, or to CSV/JSON for ingestion into your own templates. Per-LP customization allows different appendix levels (a fund-of-funds LP may want more detail than a family-office LP).
Three disciplines that make automation actually work
Finalize the narrative yourself. The auto-drafted commentary is fine as structural scaffolding, it summarizes what happened, flags the drivers, and writes reasonable descriptions of the attribution, but it reads like every other auto-generated LP report, and LPs have been reading those for years. They can spot them. The specific tells are: "The portfolio benefited from..." / "We remained cautiously optimistic..." / "Our thesis continues to be...", phrasing that floats above the data rather than engaging with it. Rewrite the narrative to say what you actually think, with specific claims that reference the attribution. "We were long-NVDA underweight vs. benchmark for the first half of the quarter and added to it in September" is worth ten paragraphs of "we maintained conviction in our positioning."
Include attribution even if you don't talk to it. Some PMs skip attribution in the narrative because it doesn't flatter them ("We underperformed because our sector bets went against us"). Don't. Institutional LPs increasingly expect attribution as a standard deliverable, and its absence signals that you're either not running it or not comfortable showing it. Having it visible in the report, even if your commentary focuses elsewhere, signals operational rigor. LPs with internal investment-risk teams will look at it even if you don't highlight it.
Version every export. Each LP report you send out is a legal document in the sense that it represents what you told your investors at a specific point in time. Six months from now, if an LP asks why their Q2 return differed from what a peer's copy showed, you need the exact version you sent them. The card's export timestamp and archive feature handle this automatically; the PM's discipline is to use the archived versions rather than regenerating fresh each time.
What to leave to the machine and what to write yourself
Handle mechanically:
- Return calculations (gross, net, time-weighted, money-weighted)
- Attribution decomposition
- Risk metric computation
- Position list assembly
- Trade activity log
- Benchmark comparison
- Compliance event log
Write yourself:
- The executive summary (2–4 paragraphs)
- The narrative around the top contributors and detractors
- Outlook commentary
- Response to any LP questions from the prior period
- Exception narrative (anything unusual in positioning, gross exposure shifts, new risk concentrations)
The machine is strictly better at the first list; you are strictly better at the second. The art is not blurring the boundary.
Example: compressing a quarterly report
A typical Q3 2025 quarterly close for a hypothetical $80M long/short equity fund using the card:
- Monday morning: generate the full auto-report, review the raw numbers for any data-quality flags, fix any stale-price or corporate-action issues in the underlying portfolio data. Takes ~60 minutes.
- Monday afternoon: draft the narrative sections, exec summary, contributor commentary, outlook. Takes ~90 minutes.
- Tuesday morning: PM partner review, final polish, cross-check numbers vs. prime-broker statement. Takes ~45 minutes.
- Tuesday afternoon: per-LP customization (varying appendix levels), PDF exports, distribution. Takes ~30 minutes.
Total: under 4 hours of PM time, vs. the 40+ hours I used to spend in the fully-manual era. The LPs get a report that's at least as good, attribution is more rigorous, risk metrics are tighter, typos are almost zero because the tables are machine-generated. The time saved goes back into research, where it compounds.
Common mistakes
- Trusting the AI-drafted narrative. It reads like AI. LPs notice. Rewrite.
- Skipping attribution because it's unflattering. Transparency builds trust with sophisticated LPs; hiding details erodes it.
- Not versioning outputs. When an LP asks about a prior report, you need the exact copy you sent, not a regenerated best-effort.
- Over-customizing per LP. Small customizations are fine; wildly different narratives for different LPs becomes impossible to defend.
- Treating the report as a marketing document. LPs who've been in the industry read through marketing gloss. Clean, direct, honest narrative is more compelling than a polished pitch.
Where it fits
LP Report feeds from most of the other portfolio cards: Attribution, Risk Metrics, Factor Analysis, and Regime Analysis all become sections. Keep those live surfaces clean and the LP report stays honest by construction. The Audit Trail supplies the compliance event log that goes into the appendix.
FAQ
How often should I issue LP reports?
Quarterly is the institutional standard; monthly interim updates (often abbreviated) are common for more active LPs. Letters outside the regular cadence happen for material portfolio events.
How long should the report be?
10–20 pages for a typical institutional quarterly. Main body under 10; appendix makes up the rest. Longer-than-20 LP reports often lose the reader; shorter-than-10 often signal under-preparation.
Can I send the same report to all LPs?
Usually yes, with limited personalization (their name, their subscription size, their return share if different from gross). Some funds with very different LP types (family offices vs. institutional) keep separate templates.
Is the AI-drafted narrative safe to send directly?
I don't recommend it. The auto-draft is a useful scaffolding; LPs can spot unedited AI output quickly, and it undermines trust. Budget an hour per report to rewrite.
What about regulatory requirements?
LP-report content isn't directly prescribed by regulators for most fund structures, but fund-level financials (AUM, share class NAVs) must reconcile to regulatory filings. Keep your LP report and your Form PF / ADV consistent.
Related reading
- Dark Pool Prints Explained
- Institutional Holders 13F
- Portfolio Alt Sentiment Integration
- Portfolio Attribution, Where Returns Come From
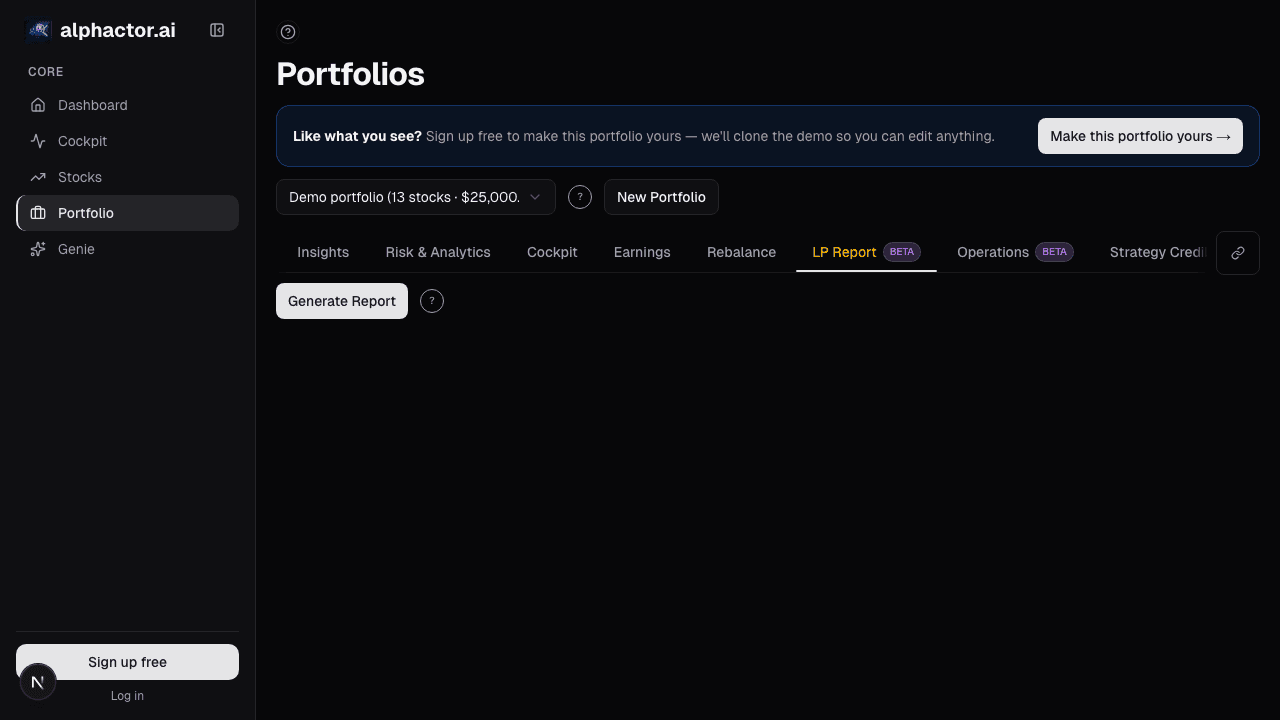
Open the LP Report card → /app/portfolio
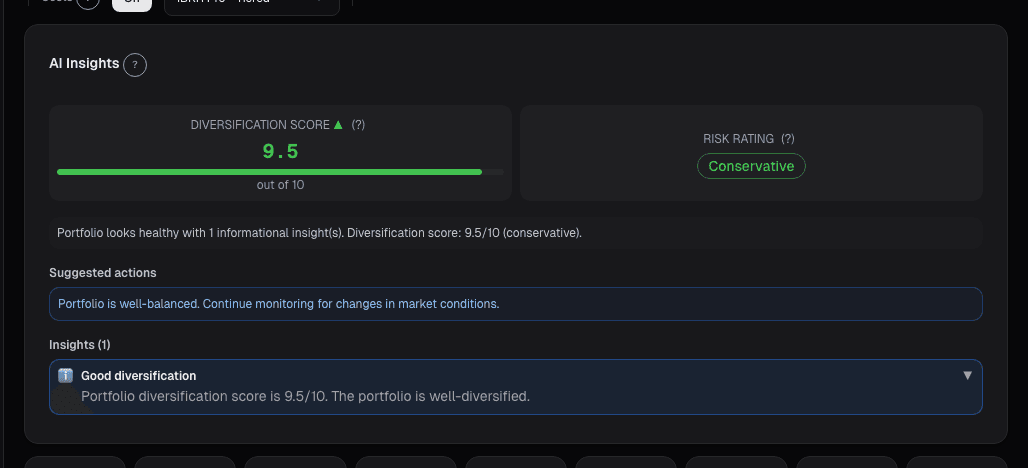
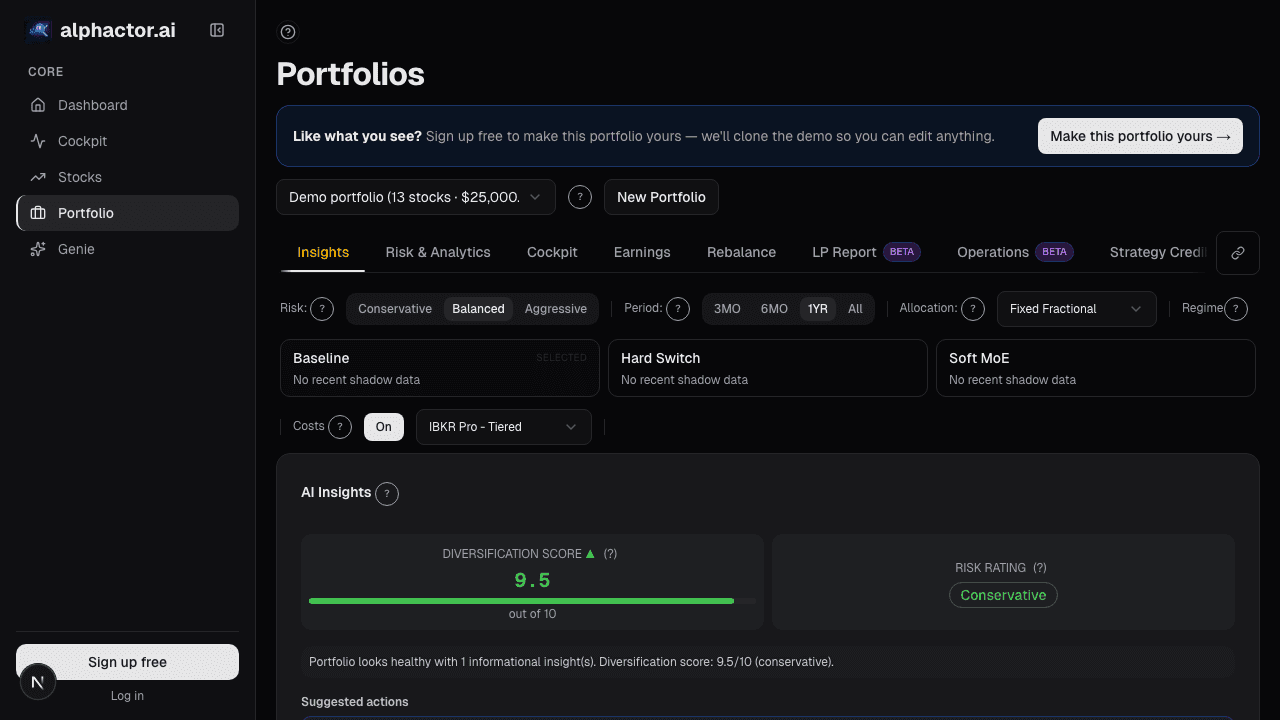
See it in the app
Live dashboard views that match this post. Each tile deep-links to the exact card.


Related reading
Dark Pool Activity: Reading the Institutional Order Flow
What dark pools are, why institutions use them, and how tracking dark pool prints and volume can reveal where smart money is positioning before it shows up…
Dark Pool Prints
Off-exchange share above 45% clustered into weakness signals institutional accumulation. Dark pool prints are regulated, post-trade transparent, and measurable.
13F Holders: Who Owns This Stock
Raw ownership is already in the price. What isn't is portfolio-weight change, when a concentrated fund lifts a position from 1% to 4% of its book, that's a…
Alt-Data Sentiment at the Portfolio Level
Per-ticker alt-data breaks down past 10 positions. A roll-up of WSB, news, MSPR, and options lets a 90-second scan replace 100 minutes of manual checking.
Portfolio Attribution: Where Your Returns Actually Come From
Beating the benchmark by 400bps feels good until attribution tells you it was all allocation luck on one sector call. Selection vs. allocation vs.
Ready to try alphactor.ai?
Validate your trading strategies with statistical credibility testing. Start free.
Get Started Free