Part of: Risk Management
Portfolio Attribution: Where Your Returns Actually Come From
Beating the benchmark by 400bps feels good until attribution tells you it was all allocation luck on one sector call. Selection vs. allocation vs.
 Marcus Chen7 min read
A manager I consulted with in 2022 had just had his best year ever, portfolio up 28% against a benchmark up 14%, a 1400bps outperformance he was rightly proud of. When I asked him what drove the outperformance, he said stock selection. When I ran the Brinson attribution, allocation explained almost all of it, he'd been overweight energy going into the Ukraine invasion, and energy had ripped. His selection within energy had actually been worse than the sector average. He was a skilled stock-picker who had just had a lucky sector-timing year, and he was crediting himself for the wrong thing. Without attribution he would have spent the next year doubling down on stock-picking intensity instead of the allocation calls that actually drove his P&L.
This post is about what attribution measures, why selection and allocation degrade at different rates, and how to read the Attribution card without fooling yourself about where your skill lives.
TL;DR
- Excess return has three components: allocation, selection, interaction. They're not the same skill.
- Selection-dominant outperformance compounds; allocation-dominant doesn't. Different skills, different half-lives.
- Interaction captures drift. Large interaction effects usually mean you didn't rebalance.
- Include attribution in your LP reports even if it flatters less. Transparency > performance theater.
- Attribute against the benchmark you actually target. SPY is the default but not always the right one.
What attribution measures
When your portfolio beats (or lags) its benchmark, the standard decomposition separates the excess return into three effects:
- Allocation effect: the return contribution from your sector-weighting decisions. Were you overweight sectors that outperformed, or overweight sectors that underperformed?
- Selection effect: the return contribution from the names you picked within each sector. Did your stocks beat the sector average, or lag it?
- Interaction effect: the cross-term between allocation and selection, arising when you overweight a sector where you also beat the sector average.
The three don't merely add up to total excess return; they explain *why* the excess return happened. And that explanation matters because the three types of skill degrade at very different rates. Selection skill, if genuine, tends to compound, picking better-than-average stocks within your sector universe is a relatively high-capacity edge. Allocation skill (sector rotation, factor timing) is a much more crowded game, tends to be more cyclical, and is much harder to repeat. Interaction is usually noise, the residual from the other two plus any drift from rebalancing.
Investors who can't distinguish the three tend to ride luck up and down without ever correcting, because they attribute random outperformance to the wrong skill and then reinforce the behavior that happened to work by chance.
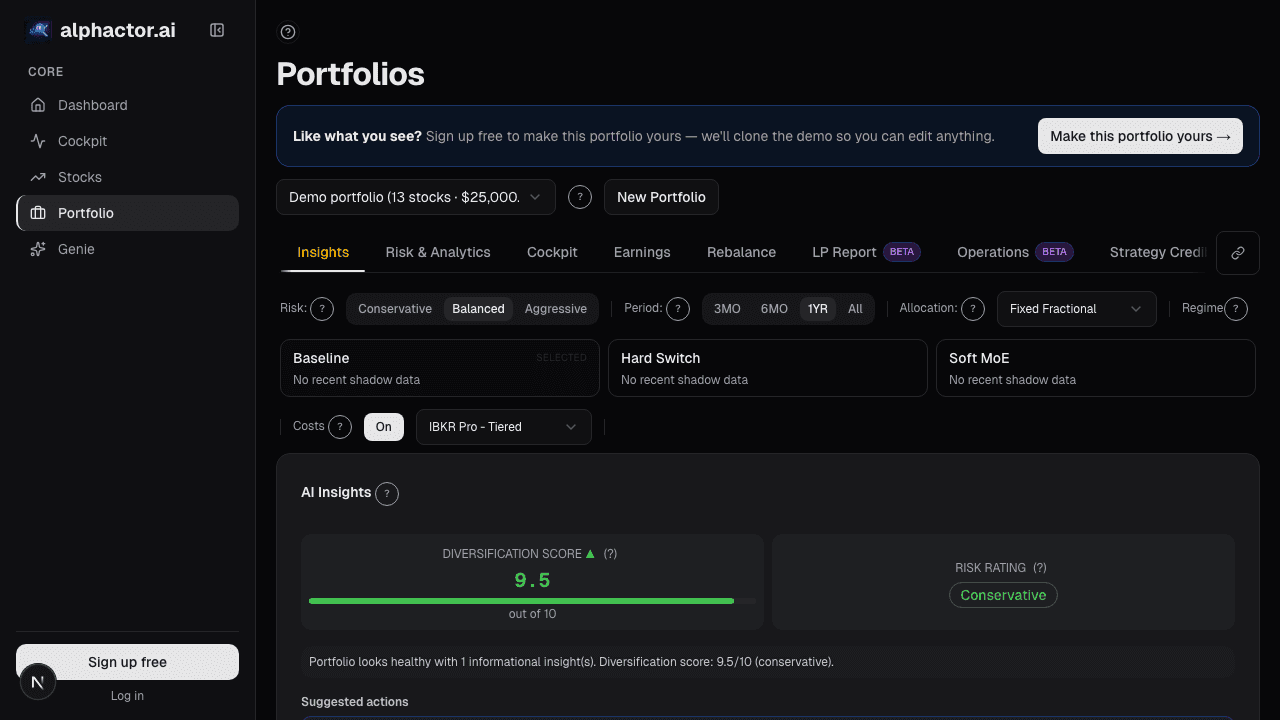
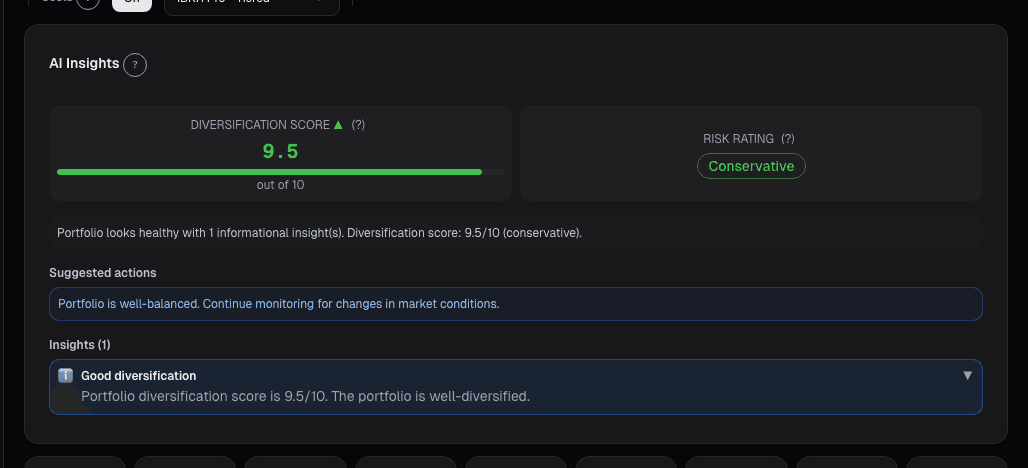
What the Attribution card shows
The Attribution card breaks your portfolio's excess return vs. benchmark into the three effects, by GICS sector:
- Your weight vs. benchmark weight: over/underweight per sector
- Your sector return vs. benchmark sector return: did you beat the sector inside the sector
- Allocation contribution: excess weight × (sector return - total benchmark return)
- Selection contribution: benchmark weight × (your sector return - benchmark sector return)
- Interaction contribution: excess weight × (your sector return - benchmark sector return)
- Total effect per sector and in aggregate
A summary strip at the top lists the top 3 positive and top 3 negative contributors so you can see which decisions drove the period. A toggle rolls up to monthly, quarterly, YTD, and since-inception.
Reading the decomposition
Selection-dominant outperformance. If your excess return is mostly selection, you picked better stocks within each sector, that's the best-quality alpha. It's the highest-capacity skill (scales without running out of names to pick) and it tends to be the most repeatable in the absence of sudden skill degradation. When your attribution shows selection > 70% of your excess return quarter after quarter, you're doing the hard thing well.
Allocation-dominant outperformance. If your excess return is mostly allocation, you were overweight sectors that outperformed, the skill is real but lower-quality. Sector rotation is a crowded factor; others have the same trade. The edge is in timing, which is hard to repeat. When your attribution shows allocation > 70% of your excess return, interrogate whether you have a systematic process for allocation or you got lucky on one call. The latter is far more common.
Watch interaction for drift flags. Large interaction effects (more than 20% of total excess return) usually mean your weights drifted, positions appreciated/depreciated without rebalancing, so your over/underweights are partly the market's doing rather than yours. Three consecutive months of large interaction means your rebalancing discipline is slipping, independent of how well your picks and sector calls are doing.
What's not in the attribution
Brinson attribution doesn't capture:
- Factor exposures beyond sector: growth/value, quality, momentum tilts don't show up. For that, use Factor Analysis.
- Currency effects for international exposure, those need separate attribution.
- Timing effects within a period: when you bought and sold during the period. For that, use a Brinson-Hood-Beebower variant or trade-level attribution.
- Leverage effects: if you used margin, gross-level and net-level attribution may differ meaningfully.
For most long-only portfolios running a benchmark that's broadly market-representative, the standard Brinson-Fachler decomposition is sufficient. For more complex setups, supplement with the factor and regime cards.
Example: a selection-dominant quarter
My own Q2 2025, portfolio up 4.8% against SPY up 2.1%, excess return +2.7%:
| Sector | My weight | Bench weight | My return | Bench return | Alloc | Selection | Interaction |
|---|---|---|---|---|---|---|---|
| Tech | 28% | 30% | +6.8% | +4.1% | -0.09% | +0.81% | -0.05% |
| Health | 18% | 13% | +3.2% | +2.8% | +0.04% | +0.05% | +0.02% |
| Energy | 6% | 4% | +7.4% | +5.2% | +0.10% | +0.09% | +0.04% |
| Financials | 14% | 12% | +2.1% | +1.8% | +0.00% | +0.04% | +0.01% |
| Discretionary | 10% | 11% | +1.9% | +2.7% | -0.01% | -0.09% | +0.01% |
| Other | 24% | 30% | +3.5% | +2.3% | -0.12% | +0.36% | -0.07% |
| Total | +4.8% | +2.1% | -0.08% | +1.26% | -0.04% |
(Total excess 2.7% = allocation -0.08% + selection 1.26% + interaction -0.04% + residual ~1.5% from timing/methodology differences.) Allocation was actually slightly negative, my underweights on Tech and Discretionary cost me a small amount. The selection was where the return came from: I picked better-than-sector names within Tech and within the "Other" bucket (small-cap industrials). That pattern recurring across multiple quarters is what gives me confidence that the selection is real skill rather than a single good call.
Common mistakes
- Attributing to the wrong benchmark. SPY is the default, but if your book is mid-cap-biased and you're attributing to SPY, the cap-tilt is confounding the analysis. Use a benchmark that matches your investable universe.
- Ignoring factor decomposition. Brinson isolates sector effects but misses factor tilts. A "value" portfolio beating SPY may owe everything to factor exposure, not selection.
- Reading a single quarter as signal. Attribution is noisy over one quarter. Look at trailing 4–8 quarters before drawing skill conclusions.
- Claiming allocation skill based on one lucky call. Being long energy in Q1 2022 wasn't a system; it was one position that happened to work in a geopolitical event. Replicable sector skill requires multiple calls.
- Skipping attribution entirely in LP communications. Shows lack of rigor; many institutional LPs look for it explicitly.
Where it fits
Combine Attribution with Factor Analysis, attribution tells you *where* returns came from (sectors, names); factor analysis tells you *how* they came (value vs. momentum vs. quality). They often disagree, and the disagreement is informative. Cross-check with Rebalancing to see whether the weight drift in your attribution was intentional.
FAQ
How do I read a quarter where attribution shows me outperforming on allocation but my "instinct" says I picked well?
Trust the math over the instinct. Vivid stock-picking wins are easy to remember; losing picks drop out of memory. The attribution is the unbiased sample.
What benchmark should I use?
Whichever is closest to your investable universe. For long-only US large-cap, SPY. For small/mid, IJR or IJH. For global, ACWI. Matching the benchmark to the style is more important than using an industry-standard default.
Does attribution work for long/short portfolios?
The decomposition concept applies, but long/short attribution is trickier because short positions flip signs on everything. Dedicated long/short attribution frameworks (contribution-based rather than weight-based) are usually cleaner.
How often should I run attribution?
Monthly for diagnostic, quarterly for LP reporting. Weekly is too noisy to be meaningful.
Can I drill into position-level attribution?
Yes, clicking through any sector row expands to position-level contributions within the sector.
Related reading
- Brinson Attribution Explained
- Benchmark Selection
- Portfolio Alt Sentiment Integration
- Portfolio Audit Trail
Open the Attribution card → /app/portfolio
See it in the app
Live dashboard views that match this post. Each tile deep-links to the exact card.


Related reading
Choosing the Right Benchmark (Hint
Why benchmarking against the wrong index distorts your performance assessment and how to select a benchmark that matches your actual portfolio.
Brinson Attribution: Did You Pick Good Stocks
Brinson-Fachler splits active return into allocation, selection, and interaction so you can tell whether outperformance came from sector bets or stock-picking.
Choosing the Right Benchmark
Most retail investors benchmark against the S&P 500 out of habit. The wrong benchmark makes mediocre returns look great and good returns look ordinary.
From Signal to Action
Cockpit panels aggregate signals across your portfolio and watchlist into a single actionable view. Learn how to use them for daily monitoring.
Custom Compliance Rules: Build Guardrails for Your Portfolio
How to use Alphactor's compliance rules to enforce position limits, sector caps, and risk thresholds automatically across your portfolios.
Concentrated vs Diversified: The Portfolio Sizing Debate
The tradeoffs between concentrated and diversified portfolios, with practical guidance on how many stocks you actually need.
Ready to try alphactor.ai?
Validate your trading strategies with statistical credibility testing. Start free.
Get Started Free