Choosing the Right Benchmark
Most retail investors benchmark against the S&P 500 out of habit. The wrong benchmark makes mediocre returns look great and good returns look ordinary.
 Marcus Chen5 min read
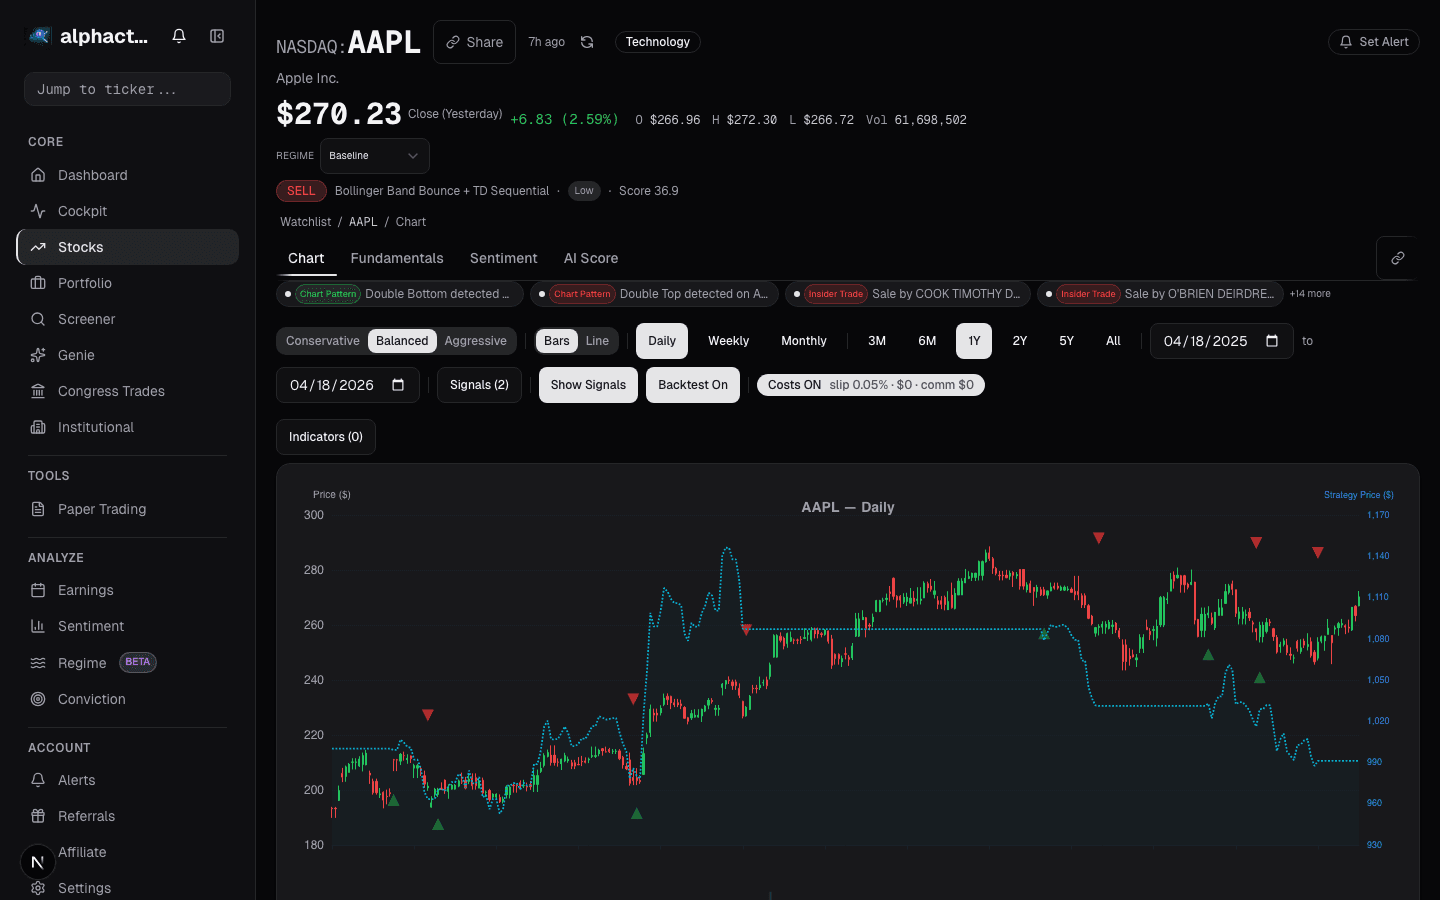
The Default Benchmark Problem
Open any brokerage app and the default comparison is SPY or the S&P 500. It is the closest thing the market has to a universal yardstick, it is the number on CNBC every day, and it feels like a neutral reference.
It is not neutral. The S&P 500 is a specific bet: 500 of the largest US stocks, cap-weighted, heavy tech and financials, zero small-caps, zero international. If your portfolio is 20% small-caps, 10% emerging markets, and 15% energy, comparing to the S&P 500 is like scoring a basketball game on football rules. The number you get back is real, but it does not tell you what you actually want to know.
And here is the worse version: using the wrong benchmark makes you wrong in two directions.
- In a year where the S&P 500 trails small-caps, your small-cap-heavy portfolio looks brilliant when it was just average for its actual exposure.
- In a year where the S&P 500 is led by a handful of mega-caps, your diversified portfolio looks weak even though it outperformed its actual risk bucket.
You cannot tell whether you have skill or just different exposures from a single headline number.
What a Benchmark Actually Has to Do
A usable benchmark has three properties:
- It matches your investable universe. If you never buy small-caps, do not benchmark against a universe that includes them. The benchmark should be something you could plausibly hold as a passive alternative.
- It matches your sector and factor tilts. If your portfolio is structurally overweight tech, the benchmark should not be neutral to tech. Otherwise the "alpha" number you calculate is just the sector bet.
- It updates at the same frequency as your portfolio. Daily portfolio returns need daily benchmark returns. Monthly rebalancing needs monthly returns. Mixing frequencies injects fake tracking error.
Most free tools get all three wrong. They show you SPY vs. your portfolio on a daily chart, mix in your intraday trades, and call it analysis.
What We Use Instead
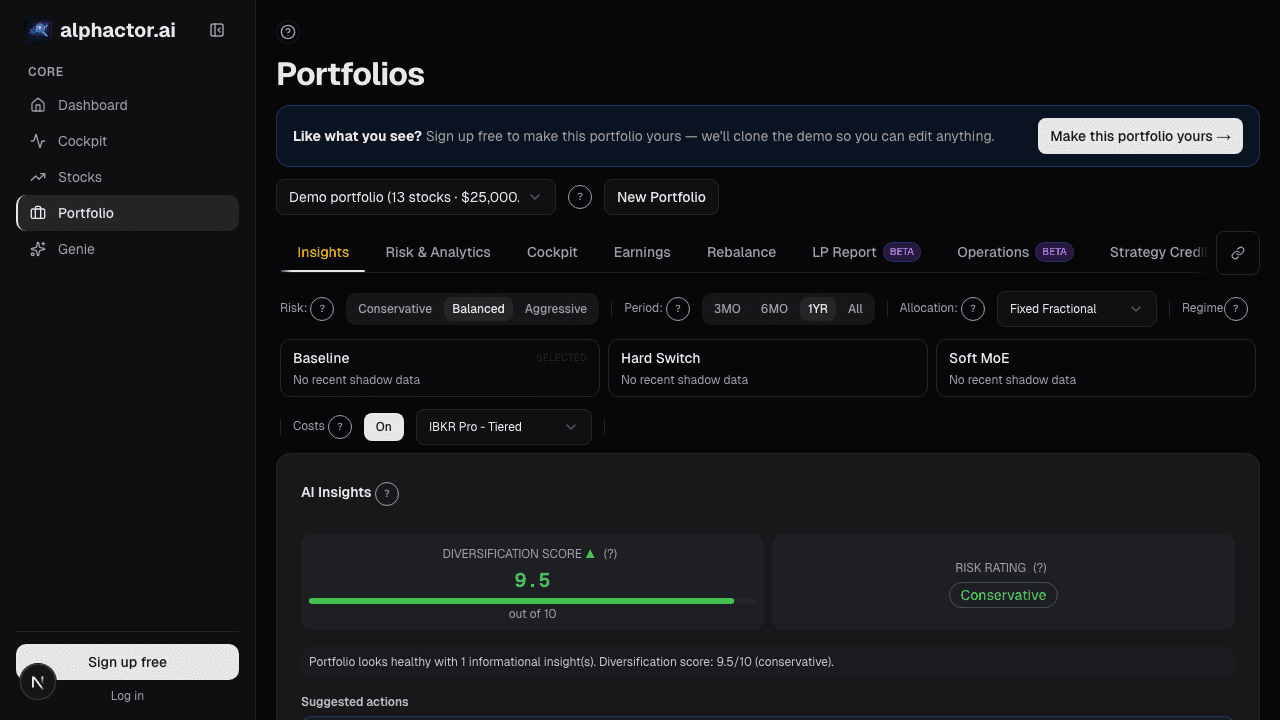
Alphactor's analytics pick the benchmark automatically based on your portfolio's profile. The logic runs in roughly this order:
- Large-cap US portfolios (average market cap >$50B, mostly domestic): S&P 500 Total Return. This is the default for most diversified portfolios.
- Small-cap tilted (>20% of weight in names below the Russell 2000 median): Russell 2000 Total Return. Using S&P 500 here will make a flat year look bad and a bad year look catastrophic.
- Sector-concentrated (>35% of weight in a single GICS sector): the sector ETF's index (e.g., XLK for tech-heavy, XLE for energy, XLF for financials). A tech fund compared against the S&P 500 is a tech fund compared against a 30% tech fund, that's not a benchmark, that's a different bet.
- International exposure: blended benchmark (S&P 500 + MSCI EAFE weighted to match your foreign allocation).
- Income-oriented portfolios (dividend yield >1.5× the S&P's): S&P 500 Dividend Aristocrats or a sector-matched yield index depending on holdings.
You can override the automatic pick. The override lives in Portfolio Settings → Benchmark. We log the chosen benchmark on every attribution run so the numbers are reproducible.
Why Total Return Matters
A number you often see quoted is price-only return, the S&P 500 index level without dividends reinvested. Over one year it does not matter much. Over five years it compounds to a 10% gap. Benchmarking against the price-only index makes dividend reinvestment look like alpha.
Every benchmark Alphactor uses is total return. If your portfolio is 3% yield and you are being compared against a total-return benchmark, the yield is already in the benchmark, your alpha is above-and-beyond the yield you'd get from holding the index passively. That is the number you actually want.
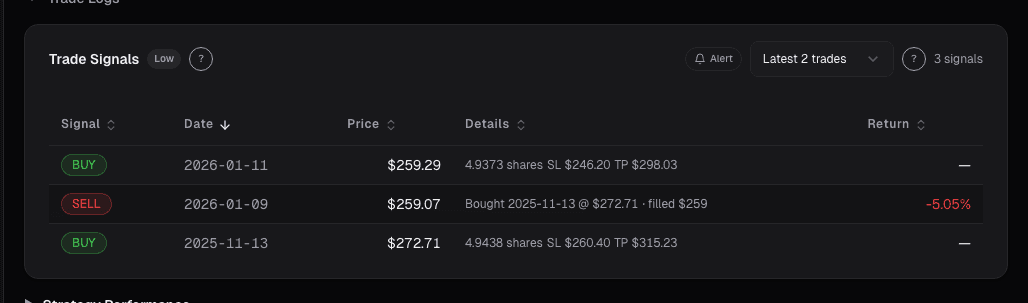
Three Practical Checks
Before you trust a performance number, answer three questions:
Does the benchmark hold what I would plausibly hold? If your universe excludes small-caps, your benchmark should too. If your universe excludes non-US, your benchmark should too. The benchmark is the thing you could replace your portfolio with, it must be reachable from your investment policy.
Is the alpha inside the standard error? A 1.5% alpha over a benchmark with 15% annualized volatility is one standard deviation of noise. It is not a result, it is a coin flip that happened to land. The analytics panel shows an alpha t-stat with every comparison, if it is below 1.5, do not over-interpret the gap.
Is the alpha stable across sub-periods? A 4% alpha for a year that came entirely from one good month is a fluke. A 4% alpha distributed across eight months out of twelve is a signal. The time-period attribution on the analytics tab surfaces this immediately, if the monthly bars are wildly uneven, discount the headline number.
When the Automatic Pick Is Wrong
The benchmark selector is a heuristic. There are three cases where it will over- or undershoot:
You run a concentrated strategy inside a diversified shell. If your portfolio is 80% five-stock quality picks and 20% index funds for liquidity, the classifier sees diversification and picks the S&P 500. That's usually right, but if the 80% is pure small-cap value, you want a small-cap value index for the concentrated sleeve specifically. Use the separate sleeve view.
You hedge or run short positions. Net exposure isn't gross exposure. A market-neutral portfolio should be benchmarked against a risk-free rate or a HFR index, not SPY. The platform flags portfolios with non-trivial short exposure and asks you to confirm the benchmark manually.
Your factor tilts are extreme. A pure momentum portfolio benchmarked against SPY will show positive alpha in trending markets and negative alpha in ranges. That is not skill, it is the factor cycle. Use a factor benchmark (MTUM for momentum, QUAL for quality, VLUE for value) to measure real residual alpha.
What to Do Today
Open Portfolio → Analytics. Check the benchmark line, it should not blindly say "S&P 500." If it does and your portfolio is small-cap heavy, sector-concentrated, or globally diversified, flip the override to something that actually resembles what you hold. Then re-read your alpha.
You may find that a 4% "outperformance" was 0.5% after honest benchmarking. That is not demoralizing, it is useful. You now know where to work.
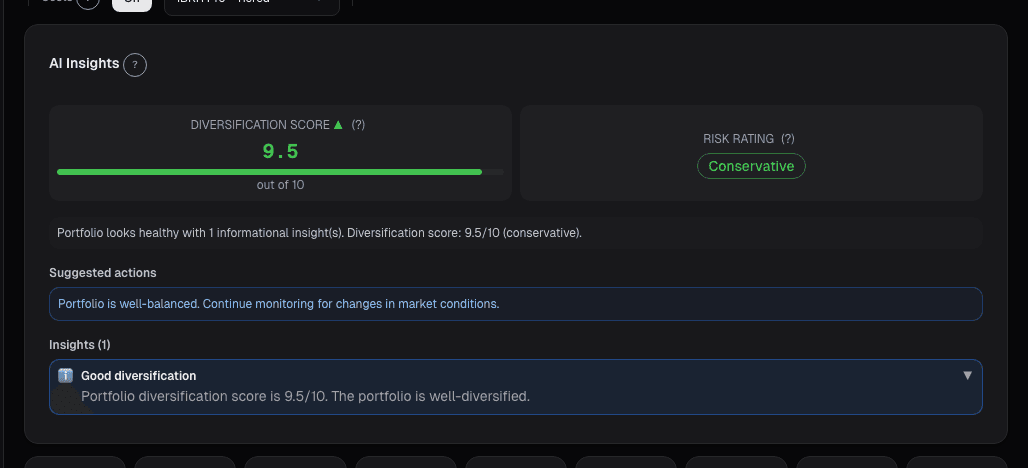
See it in the app
Live dashboard views that match this post. Each tile deep-links to the exact card.

Related reading
Brinson Attribution: Did You Pick Good Stocks
Brinson-Fachler splits active return into allocation, selection, and interaction so you can tell whether outperformance came from sector bets or stock-picking.
Advanced Chart Analytics: Autocorrelation, Seasonality
Beyond moving averages and RSI lives a deeper layer of statistical diagnostics. Hurst exponent, autocorrelation, and seasonality tell you which strategies…
Chart Benchmark: Relative Strength Is Where the Alpha Lives
Absolute price charts hide what's tradeable. Plotting a stock as a ratio against SPY, its sector, or a peer group reveals the idiosyncratic alpha that…
Portfolio Attribution: Where Your Returns Actually Come From
Beating the benchmark by 400bps feels good until attribution tells you it was all allocation luck on one sector call. Selection vs. allocation vs.
Universe Portfolios
Model portfolios show full-book behavior that name-level backtests miss. Comparing with regime-conditional Sharpe reveals tail risk that annual averages hide.
Ready to try alphactor.ai?
Validate your trading strategies with statistical credibility testing. Start free.
Get Started Free