Universe Portfolios
Model portfolios show full-book behavior that name-level backtests miss. Comparing with regime-conditional Sharpe reveals tail risk that annual averages hide.
 Marcus Chen6 min read
Three years ago I was considering a shift toward a more "quality-growth" style for the core of my book. Every piece of writing I'd read on the style presented a rosy picture, long-term backtest Sharpe around 1.0, low drawdowns in normal markets, etc. I pulled up the quality-growth model portfolio and sorted the performance by market regime. The overall numbers were fine, but the regime-conditional breakdown was humbling. In high-vol corrections, the quality-growth model had a Sharpe of 0.2, not 1.0. It had lost 24% in the March 2020 drawdown before recovering, and 18% in the Q4 2018 drawdown before recovering. Those drawdowns didn't show up in the headline ratio because the calm-regime performance was strong enough to overwhelm them. Seeing the regime-conditional performance changed how I thought about the style: I was willing to adopt it, but only with an explicit hedge for high-vol corrections and a sizing rule that reduced exposure in regimes the model historically struggled in. Without the regime breakdown, I would have adopted the style at full size and been surprised by the first correction. Model portfolios, backtested consistently, broken out by regime, and available side-by-side, are a research surface, not just a performance table.
This post is about the Universe Portfolios card, why model portfolios are a better research surface than name-level backtests, and the three uses that turn "here's a model Sharpe ratio" into "here's how this style will behave in my actual portfolio."
TL;DR
- Model portfolios show full-book behavior, not cherry-picked names.
- Regime-conditional performance reveals the tail risk that average Sharpe hides.
- Use models as explicit benchmarks for your actual book: style-drift shows up as underperformance vs. model.
- Monthly composition diffs are idea-generation fuel: see where the underlying factor is moving.
- Side-by-side comparison of 2-4 models is where the learning happens; single-model study is limited.
Why model portfolios are a research surface
Reading about a strategy, "quality-growth works", is not the same as seeing the full portfolio behavior quarter-by-quarter across 5+ years. Name-level backtests miss the interaction effects (how names move together in drawdowns), the rebalancing drag, and the regime-conditional structure. Model portfolios are the operational version of a strategy: a specific rules-based construction, held consistently, rebalanced on a fixed schedule, with all the execution reality baked in.
What models give you that aggregate style research doesn't:
- Full-book drawdown behavior: did the strategy take a 40% drawdown in 2008, or did quality-growth hold up relatively?
- Regime-conditional Sharpe: the average Sharpe hides huge regime variation
- Monthly composition changes: see the strategy rotate as factors move
- Attribution: did a good year come from one star name or from broad style tailwind?
- Explicit benchmark for your book: if you claim your style, the model is the test
What the Universe Portfolios card shows
The Universe Portfolios card hosts a library of rules-based model portfolios:
- Quality-growth: top-quartile ROE with top-quartile revenue growth
- Deep-value: bottom-quartile EV/Revenue paired with reasonable quality
- Low-vol: lowest 90-day realized vol with positive earnings revisions
- High-momentum: top-decile 12-month-minus-1-month returns
- Contrarian rebound: largest 6-month drawdowns with improving credibility scores
- Factor blends: pre-designed mixes (quality+value, momentum+low-vol)
For each model, the card shows:
- Current composition: every holding with weight
- YTD / 1y / 3y / 5y returns with benchmark comparison
- Realized vol, max drawdown, Sharpe
- Regime-conditional breakdown: performance in low-vol uptrend vs. high-vol correction vs. range-bound
- Monthly composition delta: rebalances over time, showing factor rotation
- Side-by-side compare: stack up to 4 models for direct comparison
- Custom benchmark: compare to your own book or a named index
Three uses
Use models as explicit benchmarks for your book. If you claim to run a quality-growth style, compare your book's monthly returns to the quality-growth model. Consistent underperformance of 300-400 bps/year means either your execution is off (missing the style in ways you didn't notice), or you're running a different style than you thought. The model is the accountability tool; running a style without a benchmark for it is a conversation with yourself.
Study regime-conditional behavior before adopting a style. Headline Sharpe is an average across regimes. Some styles have high average Sharpe and hidden tail risk, they perform beautifully 80% of the time and catastrophically 20%. The regime-conditional breakdown exposes this. A 1.2 Sharpe strategy with 0.3 Sharpe in high-vol corrections tells you exactly where the tail risk lives. Knowing this before adoption lets you size appropriately or add hedges; learning it during the first bad regime is expensive.
Diff model compositions monthly to track factor rotation. Watching how the quality-growth model composition changes each month is efficient macro intelligence: which sectors the factor is rotating into, which names are entering or exiting, how the style is evolving. This often generates shortlist ideas for your own research, new additions to the model are names the style's rules think are high-signal, and worth spending time on.
Example: the regime-conditional learning
The breakdown I saw on the quality-growth model before adoption:
| Regime | Sharpe | Max Drawdown | Avg Monthly Return |
|---|---|---|---|
| Low-vol uptrend | 1.6 | -4.1% | +1.9% |
| Range-bound | 0.9 | -7.5% | +0.6% |
| High-vol correction | 0.2 | -24.1% | -1.8% |
| Trending recovery | 1.3 | -5.8% | +1.4% |
| Overall (5y) | 1.0 | -24.1% | +1.1% |
The headline 1.0 Sharpe was accurate but misleading, it averaged across regimes that looked very different. The 0.2 Sharpe in corrections wasn't a data point you could easily recover from in a live portfolio; the -24% drawdown was the kind of thing that would have blown out my stop-losses if applied mechanically. Adoption strategy: shifted the core style to quality-growth but implemented a regime filter that cut exposure by 50% when the regime indicator flipped to high-vol correction. In the subsequent 2-year period that included one significant correction, the hybrid implementation drew down 12% vs. the pure model's ~22%. The regime-conditional view let me keep most of the upside without the full tail.
What the card can miss
- Transaction costs at scale. Models are backtested without assuming price impact; large live portfolios would see slippage the model ignores.
- Tax efficiency. Models rebalance without regard to tax; real portfolios can't.
- Survivorship bias in the universe. Models are run on the current universe; delisted names don't contribute. Hit rates may be overstated.
- Look-ahead in factor definitions. Some factor definitions implicitly use future data; the card flags models where this is a risk.
- Style-drift in the factor itself. "Quality" in 2010 may not be the same set of names or characteristics as "quality" in 2025.
Common mistakes
- Adopting a style based on headline Sharpe alone. The regime breakdown is the key input.
- Copying composition directly. Models are educational; copying mechanically without understanding transaction costs or regime sensitivity is expensive.
- Ignoring side-by-side. Single-model study misses the "compared to what?" question.
- Reading only recent performance. Strategies cycle in favor; a 3-year lookback is the minimum useful window.
- Skipping the monthly diffs. The evolution of a model is as informative as any single snapshot.
Where it fits
Pair with Universe Browser for ad-hoc screens, Universe Trends for the factor-rotation context, and Portfolio Optimizer to build your own optimized book from a selected model's universe.
FAQ
How often are models rebalanced?
Monthly by default; some (momentum, contrarian) rebalance quarterly. Rebalance schedule is disclosed per model.
Can I build a custom model?
Yes, premium feature. Define the rules, choose the universe, set the rebalance cadence.
Are the models live or backtested?
Both. Historical backtest covers 10+ years; live tracking begins from the card's launch date. Live tracking excludes look-ahead concerns.
Does it account for dividends?
Total returns with dividends reinvested. Price-only returns available as a toggle.
How comparable are the models to ETFs?
Models share factor DNA with factor ETFs (MTUM for momentum, QUAL for quality, etc.) but the specific rule-sets differ. Treat as related, not identical.
Related reading
- Universe Trends, Sector Rotation
- Choosing the Right Benchmark
- Brinson Attribution Explained
- Stock Universe Explained
Open the Universe Portfolios card → /app/universe
See it in the app
Live dashboard views that match this post. Each tile deep-links to the exact card.

Related reading
Brinson Attribution: Did You Pick Good Stocks
Brinson-Fachler splits active return into allocation, selection, and interaction so you can tell whether outperformance came from sector bets or stock-picking.
Choosing the Right Benchmark
Most retail investors benchmark against the S&P 500 out of habit. The wrong benchmark makes mediocre returns look great and good returns look ordinary.
What Is a Stock Universe and How Smart Investors Use One
How defining a stock universe sharpens your research process, reduces noise, and helps you focus on opportunities that match your strategy.
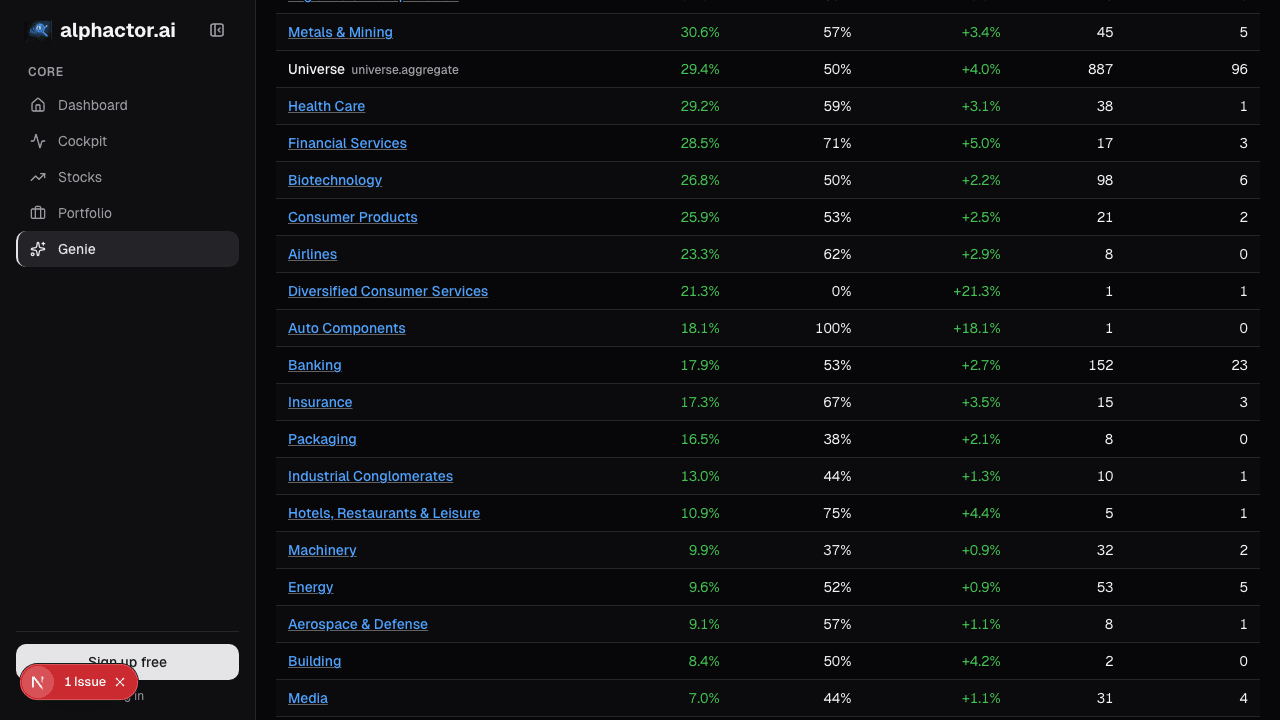
Universe Trends
Sector dispersion over 10-week windows runs 12-18 percentage points. Identifying the rotation before the macro narrative forms matters more than stock-picking.
Ready to try alphactor.ai?
Validate your trading strategies with statistical credibility testing. Start free.
Get Started Free