Brinson Attribution: Did You Pick Good Stocks
Brinson-Fachler splits active return into allocation, selection, and interaction so you can tell whether outperformance came from sector bets or stock-picking.
 Marcus Chen5 min read
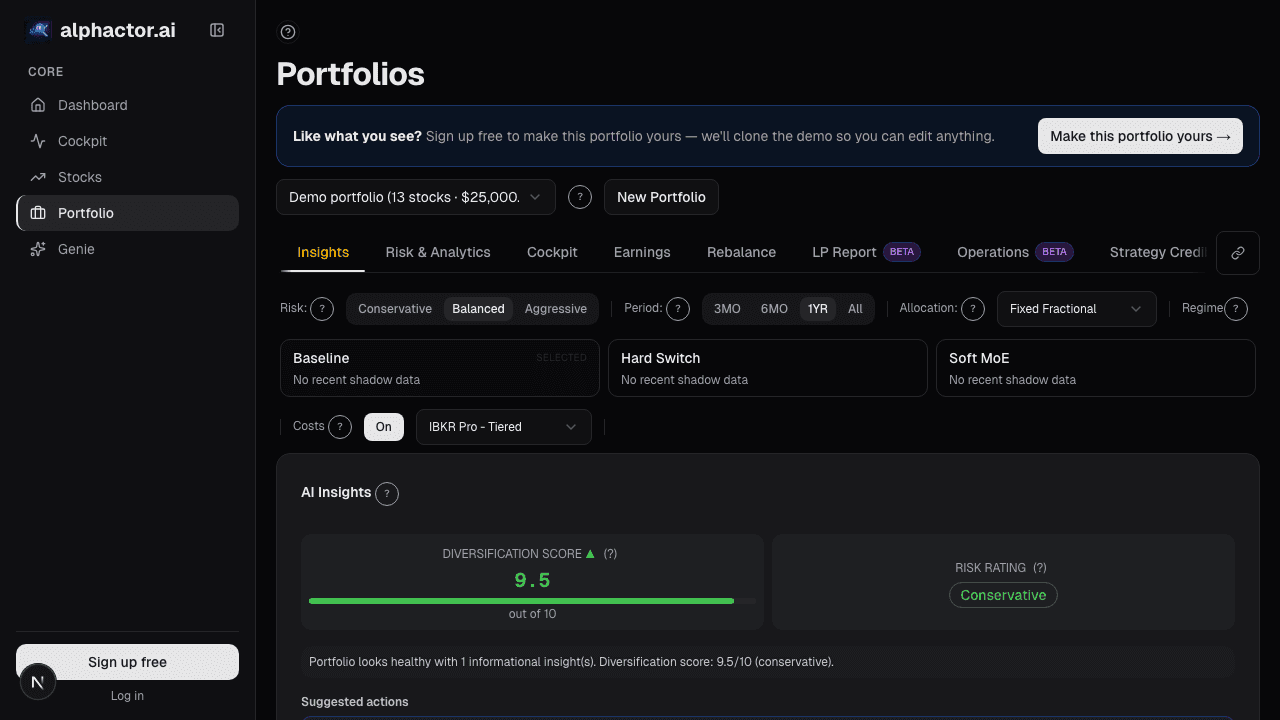
The Question You Actually Want Answered
You beat the S&P 500 by 3% last year. Good. Now answer this: did you beat it because you overweighted tech, or because the five tech names you picked were better than the average tech name? Those are two very different skills. One is a sector bet that a $10 ETF can replicate. The other is stock selection, the thing you are paying yourself to do.
If you cannot tell the two apart, you cannot improve either. You'll keep swinging harder on whichever skill actually produced the return, without knowing which one it was.
The Brinson-Fachler Framework
Brinson-Fachler is a 1985 portfolio-attribution method that decomposes active return into three sources:
- Allocation effect. Did you overweight or underweight a sector relative to the benchmark? Being overweight tech when tech outperformed gives you a positive allocation effect.
- Selection effect. Inside each sector, did the stocks you held outperform the sector's benchmark constituents? Holding NVDA and MSFT instead of an equal-weight tech basket, when NVDA and MSFT beat the sector, gives you a positive selection effect.
- Interaction effect. The cross-term: you overweighted a sector *and* picked winners in it. Small but non-zero, and important for honest accounting.
The three effects add up to your active return. If your alpha is 3% and the decomposition says allocation was -0.5%, selection was 3.2%, interaction was 0.3%, the story is: your sector bets actually cost you, but your stock picking inside sectors made it back and then some. That is a very different story than the headline number suggests.
Why It Matters More Than the Headline Number
Consider two portfolios that both beat the benchmark by 3%.
Portfolio A is 60% energy (benchmark weight 4%) and the energy holdings lagged the sector average. Allocation +4.2%, selection -1.2%. You got lucky owning the right sector. Next year, if energy reverses, your skill, which was zero, shows up as a 4% drawdown.
Portfolio B is benchmark-weight across every sector and the individual picks inside each sector outperformed. Allocation 0%, selection +3%. You demonstrated stock-picking skill. Next year, even if sectors rotate, the same skill is likely to apply.
Both returned the same 3%. Only Portfolio B has a repeatable edge. Brinson tells you which one you're running.

How Alphactor Computes Attribution
The attribution engine takes three inputs:
- Your portfolio's weights and returns by sector.
- The benchmark's sector weights and returns (we support S&P 500, Russell 1000, and a set of sector-specific benchmarks, the selection is automatic based on your portfolio's profile).
- The underlying holdings' returns to compute the in-sector contribution.
It runs three attributions in parallel using a thread pool:
- Brinson-Fachler by sector: the classic decomposition across the eleven GICS sectors.
- Factor attribution: maps your returns to a factor model (market, size, value, momentum, quality). This tells you if your "stock picking" was secretly just a momentum tilt that you could have gotten from a factor ETF.
- Time-period attribution: decomposes returns across monthly and quarterly buckets so you can see *when* your skill showed up versus when you rode the market.
The three are shown in the Portfolio Analytics tab under the Attribution section. Each has a confidence band, a thin sample (fewer than six months of history) shows wider bands and a warning, because attribution from three months of data is more hallucination than analysis.
Reading Your Attribution Honestly
Three things to check when you open the panel:
Check the sign of the selection effect. If selection is negative, your stock picking is costing you and your alpha is coming from allocation or factor tilts. That is a signal to consider an ETF for sector exposure and concentrate picking effort on fewer, higher-conviction names.
Check factor attribution for hidden tilts. If 2.5% of your 3% alpha traces to a momentum factor exposure, you are running a momentum fund and calling it stock picking. Not wrong, but worth owning. A clean alpha should have a small factor residual, that is the portion the model cannot explain, and that residual is your actual skill.
Check time-period distribution. Alpha concentrated in one quarter is not a track record. Alpha distributed across many periods is. The platform flags portfolios where more than 60% of the active return comes from a single month, often earnings-season exposure that looks like skill but was really a timing bet.
When Attribution Lies
Brinson has real limitations and you should know them:
Short history. Less than six months of data is not enough to stabilize the sector effects. The platform still computes it but widens the confidence bands. Treat the numbers as directional, not final.
Concentration. If you hold three stocks, Brinson decomposition is noise. Sector allocation numbers assume enough breadth to average out idiosyncratic effects. A three-stock portfolio has no "sector effect", it has three stock effects wearing a sector's clothes.
Turnover. The classic Brinson formula assumes period-end holdings. High turnover portfolios underreport true attribution because the positions you held briefly don't show up in the end-of-period snapshot. The time-period attribution mitigates this by breaking the period into smaller windows, but very active trading still muddies the result.
What to Do Today
Open Portfolio → Analytics → Attribution. Look at the sector decomposition first. If the selection bar is larger than the allocation bar, you are a stock picker and should concentrate effort on your research process. If allocation dominates, you are a sector timer and your edge lives in macro calls, different playbook, different risks.
Then look at factor attribution. If momentum or size explains most of your active return, you are running a factor portfolio whether you knew it or not. You can either own that and lean into it, or diversify your factor exposure deliberately.
The headline return is one number. Brinson gives you three. The three tell you which of your habits are working and which are riding luck. Picking the right number to improve is the whole game.
See it in the app
Live dashboard views that match this post. Each tile deep-links to the exact card.

Related reading
Choosing the Right Benchmark (Hint
Why benchmarking against the wrong index distorts your performance assessment and how to select a benchmark that matches your actual portfolio.
Advanced Chart Analytics: Autocorrelation, Seasonality
Beyond moving averages and RSI lives a deeper layer of statistical diagnostics. Hurst exponent, autocorrelation, and seasonality tell you which strategies…
Choosing the Right Benchmark
Most retail investors benchmark against the S&P 500 out of habit. The wrong benchmark makes mediocre returns look great and good returns look ordinary.
Alt-Data Sentiment at the Portfolio Level
Per-ticker alt-data breaks down past 10 positions. A roll-up of WSB, news, MSPR, and options lets a 90-second scan replace 100 minutes of manual checking.
Portfolio Attribution: Where Your Returns Actually Come From
Beating the benchmark by 400bps feels good until attribution tells you it was all allocation luck on one sector call. Selection vs. allocation vs.
Universe Portfolios
Model portfolios show full-book behavior that name-level backtests miss. Comparing with regime-conditional Sharpe reveals tail risk that annual averages hide.
Ready to try alphactor.ai?
Validate your trading strategies with statistical credibility testing. Start free.
Get Started Free