Stock Market Seasonality: Which Calendar Effects Still Work?
An evidence-based look at the January effect, sell-in-May, the Santa Claus rally, and other seasonal patterns, separating the ones that still hold from…
 Marcus Chen4 min read
The Calendar as a Trading Signal
"Sell in May and go away" is one of the oldest adages in investing. It has been documented in market data going back to the 1600s in London and persists in modern U.S. data. From 1950 through 2024, the S&P 500's average return from November through April was roughly 7%, compared to roughly 2% from May through October. The difference is statistically significant and has survived multiple decades of scrutiny.
But the existence of a historical pattern does not mean it works as a trading strategy in real time. Transaction costs, taxes, whipsaw years, and the gradual arbitraging effect of widespread awareness all erode the practical value of calendar-based trading. The question worth answering is not whether seasonal effects exist in the data, but which ones remain useful as tilting mechanisms within a broader investment process.
The November-April Window
The six-month favorable period from November through April is the most robust seasonal pattern in U.S. equities, "working" in roughly 70% of years since 1950. The drivers are structural: institutional fund flows increase in Q4 as pension funds deploy capital, tax-loss harvesting in October creates selling pressure that resolves into January buying, and buyback blackout periods end after earnings season.
However, the May-October period is not uniformly bad. Selling in May 2020 would have missed a 20% rally. The pattern describes an average tendency, not a reliable rule. Using it as a tilt, reducing risk modestly in late spring and increasing it in late fall, is more practical than treating it as binary.
The January Effect
The January effect, where small-cap stocks outperform large caps in January, was one of the most profitable anomalies when first documented in the 1980s. Small caps outperformed by an average of 5-7 percentage points in January from 1926 to 1983.
It has since weakened considerably. Widespread awareness led to front-running, with investors buying small caps in December to capture the January rally. Tax-loss harvesting, which created the selling pressure in December that the January rebound resolved, shifted earlier as investors became aware of the pattern.
In recent decades, the January effect has been inconsistent. Some years it appears; many years it does not. As a standalone strategy, it is no longer reliable. But as a contextual factor, understanding that December small-cap weakness often reflects tax selling rather than fundamental deterioration can inform your interpretation of year-end price action.
The Santa Claus Rally
Yale Hirsch defined the Santa Claus rally as the last five trading days of December and the first two of January. Since 1969, the S&P 500 has averaged a gain of roughly 1.3% during this seven-day window, with a positive hit rate around 75%.
More interesting than the rally itself is its absence. Hirsch noted that when the Santa Claus rally fails to materialize, the following year has a weaker average return. The logic is not magical: if the market cannot rally during a period of light volume, seasonal optimism, and institutional absence, something is fundamentally wrong with the underlying bid.
In 2015, the Santa Claus rally failed, and the S&P 500 fell 10% in the first six weeks of 2016. In 2018, it failed spectacularly during the December sell-off, and January 2019 opened weak before recovering on a Fed pivot. The pattern is not predictive in isolation, but a failed Santa Claus rally should prompt you to review your risk exposure heading into the new year.
Earnings Seasonality
Beyond calendar months, there is a well-documented pattern around earnings reporting periods. Stocks tend to drift higher in the weeks leading up to their earnings report, a phenomenon called the "pre-earnings announcement drift." Research by Barber, De George, Lehavy, and Trueman documented average excess returns of roughly 1.5% in the two weeks before an earnings announcement.
The explanation is behavioral: investors anticipate that companies will beat estimates (which they do roughly 75% of the time) and position accordingly. The earnings calendar lets you track upcoming report dates and identify stocks entering this pre-announcement window.
Monthly and Day-of-Week Effects
The "turn of the month" effect remains durable: the last trading day through the first four days of the next month capture a disproportionate share of monthly returns, driven by automatic 401(k) contributions and pension fund allocations clustering around month-end. Day-of-week effects (Monday weakness, Friday strength) have largely been arbitraged away in the U.S. market.
Using Seasonality Practically
Seasonality works best as a confirming factor, not a primary signal. When your fundamental analysis, technical analysis, and sentiment indicators are telling you to add risk, and seasonal trends align with that view, you can be more aggressive. When seasonality disagrees with your other signals, it should not override them.
The investors who profit from seasonality use calendar patterns as context: understanding why December small-cap weakness is often temporary, why a failed Santa Claus rally deserves attention, and why the November-April window tends to reward being fully invested. The universe scanner makes it straightforward to track whether seasonal patterns are playing out or whether the current year is an exception. You can also use Alphactor backtesting to test how seasonal tilts would have performed on your own watchlist historically.
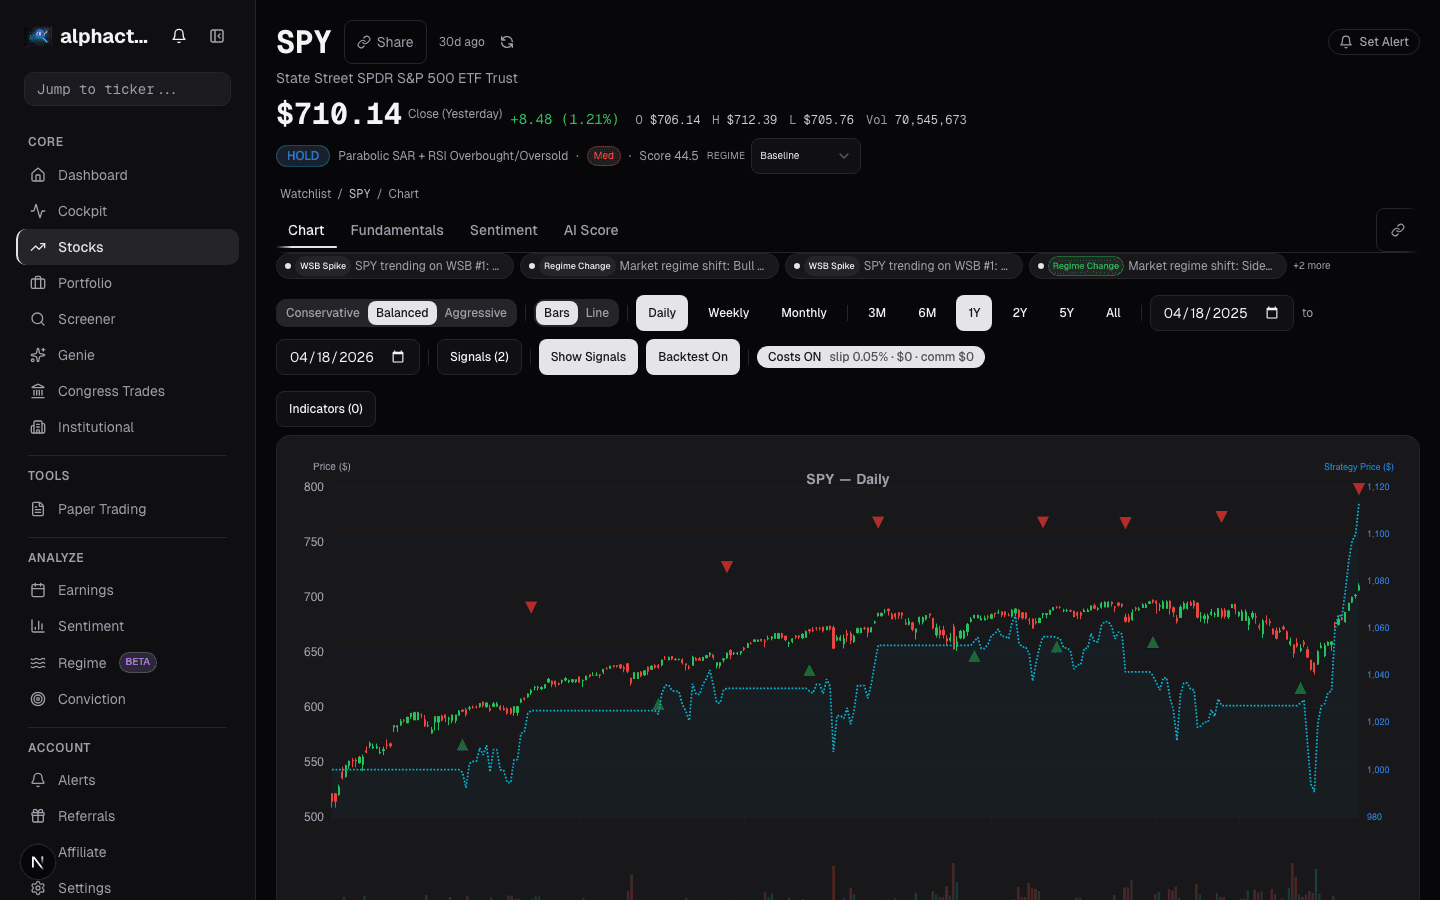
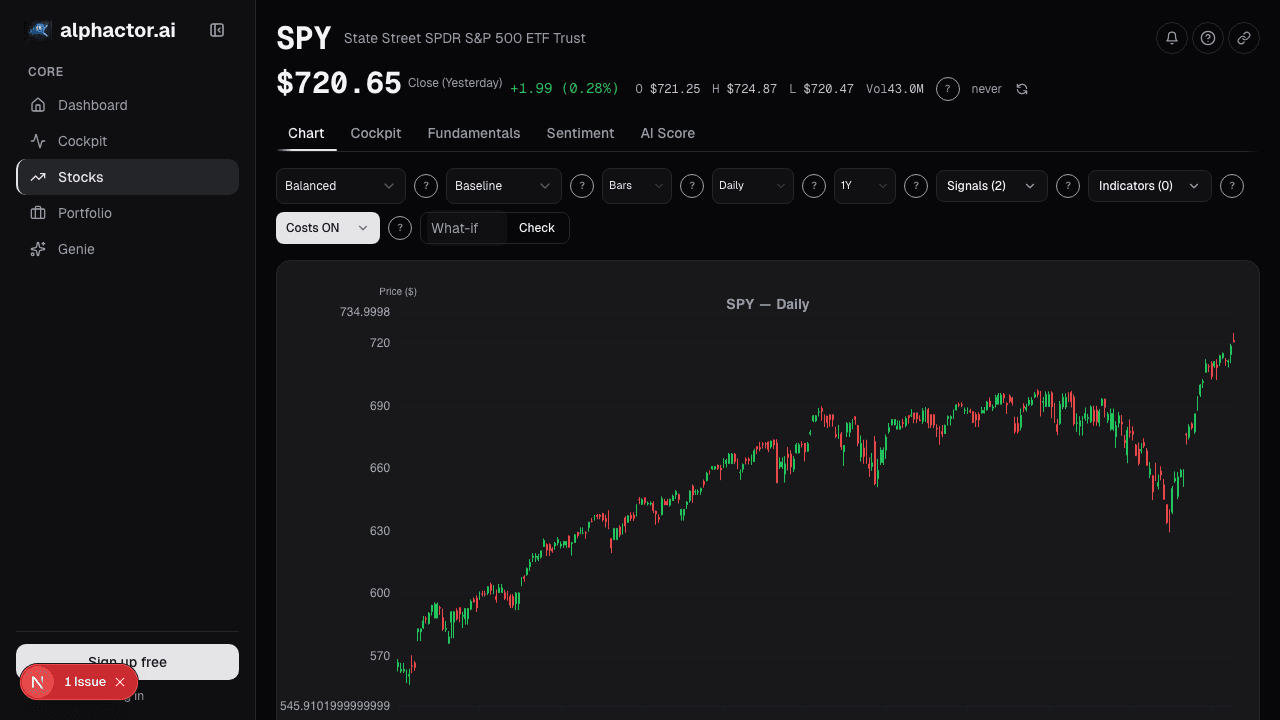
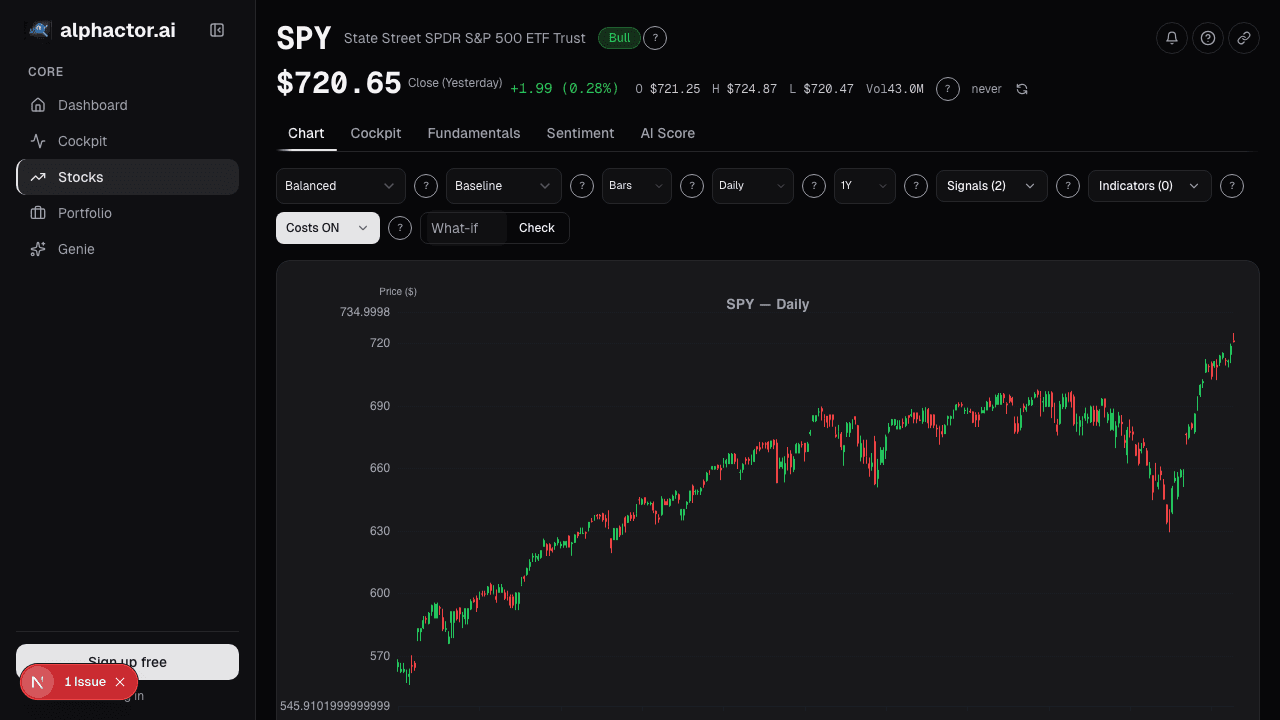
See it in the app
Live dashboard views that match this post. Each tile deep-links to the exact card.
Stocks mentioned
Related reading
Dark Pool Activity: Reading the Institutional Order Flow
What dark pools are, why institutions use them, and how tracking dark pool prints and volume can reveal where smart money is positioning before it shows up…
How Fed Policy Actually Affects Your Stock Portfolio
A practical guide to understanding how interest rate decisions, quantitative tightening, and Fed communication move equity markets at the sector and stock…
Market Breadth: The Health Check Most Investors Skip
How advance-decline lines, new highs-lows, and participation rates reveal whether a rally is built on solid ground or propped up by a handful of stocks.
What the Options Market Tells You About Stock Direction
How to read implied volatility, put/call ratios, unusual activity, and gamma exposure to extract directional signals from the options market.
Sentiment Extremes: When Fear and Greed Become Tradeable
How to identify sentiment extremes using survey data, options positioning, and fund flows, and why contrarian signals work best when combined with technical…
Small Cap vs Large Cap: When Size Matters in Stock Selection
The historical performance gap between small and large cap stocks, when each segment leads, and how to use market conditions to decide where to allocate.
Ready to try alphactor.ai?
Validate your trading strategies with statistical credibility testing. Start free.
Get Started Free