Part of: Technical Analysis
5 Candlestick Patterns With Real Statistical Edge
Most candlestick patterns are noise. Research shows only a handful have measurable predictive power, and context matters more than the pattern itself.
 Jake Morrison4 min read
75 Patterns, Maybe 5 Worth Trading
Candlestick charting books love to catalog dozens of patterns with exotic names. Three Black Crows. Abandoned Baby. Rising Three Methods. It is a taxonomy that feels precise and tradeable, right up until you try to use it with real money.
I spent my first two years of trading memorizing candlestick patterns from Steve Nison's books. I could identify a Harami Cross from across the room. My trading results during that period were my worst ever, which eventually forced me to ask an uncomfortable question: do these patterns actually have statistical edge, or am I just seeing shapes in noise?
Academic research from Thomas Bulkowski and others has tested hundreds of thousands of pattern occurrences across decades of data. The results are sobering. Most candlestick patterns, when traded in isolation, perform barely better than random. A few, however, show consistent, if modest, predictive power when combined with context.
The Five That Hold Up
1. Bullish Engulfing at Support
A bullish engulfing pattern is a two-candle formation where a small bearish candle is followed by a larger bullish candle that completely "engulfs" the first candle's body. Bulkowski's data shows a 63% success rate as a bullish reversal signal when it appears after a clear downtrend.
The critical qualifier: it needs to form at a significant support level. A bullish engulfing pattern in the middle of a downtrend with no support nearby is just a bounce, not a reversal. I look for this pattern at prior consolidation zones, round numbers, or moving average support.
2. Bearish Engulfing at Resistance
The mirror image. A large bearish candle swallowing the prior bullish candle at a resistance level. Bulkowski reports around 79% as a bearish reversal signal, though the magnitude of the subsequent decline varies significantly.
The reason engulfing patterns work better than most: they represent a clear shift in control within a single session. The opposing side not only stopped the prior move but pushed price beyond its entire range. That is a concrete power shift, not a subtle hint.
3. Hammer at Support
A hammer is a single candle with a small body near the top and a long lower shadow (at least twice the body length). It tells you that sellers pushed price down significantly during the session, but buyers reclaimed most of the lost ground by the close.
Research suggests a 60% reversal rate when hammers appear after a sustained decline at a recognized support level. The long lower shadow represents rejected selling pressure, and the close near the high shows buyers stepping in with conviction. Volume matters here, a hammer on above-average volume is considerably more reliable than one on thin volume.
4. Morning Star
A three-candle pattern: a large bearish candle, followed by a small-bodied candle (the "star") that gaps down, followed by a large bullish candle that closes above the midpoint of the first candle. Bulkowski's data shows a 78% reversal rate.
Morning stars work because they narrate a story across three sessions. Day one: sellers dominate. Day two: indecision, the selling pressure exhausts. Day three: buyers take over decisively. You are watching the psychology of a reversal unfold in real time.
I have found morning stars particularly effective on stocks that sold off sharply on earnings or news and then stabilize. AMD in October 2022 formed a textbook morning star around $56 after a prolonged decline, leading to a 35% rally over the following two months.
5. Three White Soldiers (With a Catch)
Three consecutive bullish candles with each closing progressively higher, each opening within the prior candle's body. This is a bullish continuation pattern with a roughly 82% success rate in Bulkowski's data.
The catch: it works best as confirmation of a trend that has already started, not as an entry signal. By the time three white soldiers form, the move is underway and your risk-reward may be unfavorable for a new entry. I use it primarily as confirmation to hold an existing position, not to initiate one.
Context Beats Pattern Every Time
Here is what the pattern-catalog approach gets wrong: it treats candlestick formations as standalone signals. A bullish engulfing pattern means something entirely different depending on where it forms.
At a major support level after an extended decline? That is significant. In the middle of a channel with no structural significance? It is noise.
The variables that matter more than the pattern itself:
Location. Patterns at key support/resistance levels have dramatically higher success rates than patterns in open space. This is not close, it is the single biggest factor.
Volume. A reversal pattern on volume 2-3x the 20-day average is far more reliable than the same pattern on below-average volume. Volume is the difference between conviction and accident.
Trend context. A bullish reversal pattern after a 30% decline is a different animal than the same pattern after a 5% pullback in a raging uptrend.
Timeframe. Daily candlestick patterns are more reliable than hourly or 15-minute patterns. Weekly patterns are the most reliable but give you fewer opportunities.
Practical Application
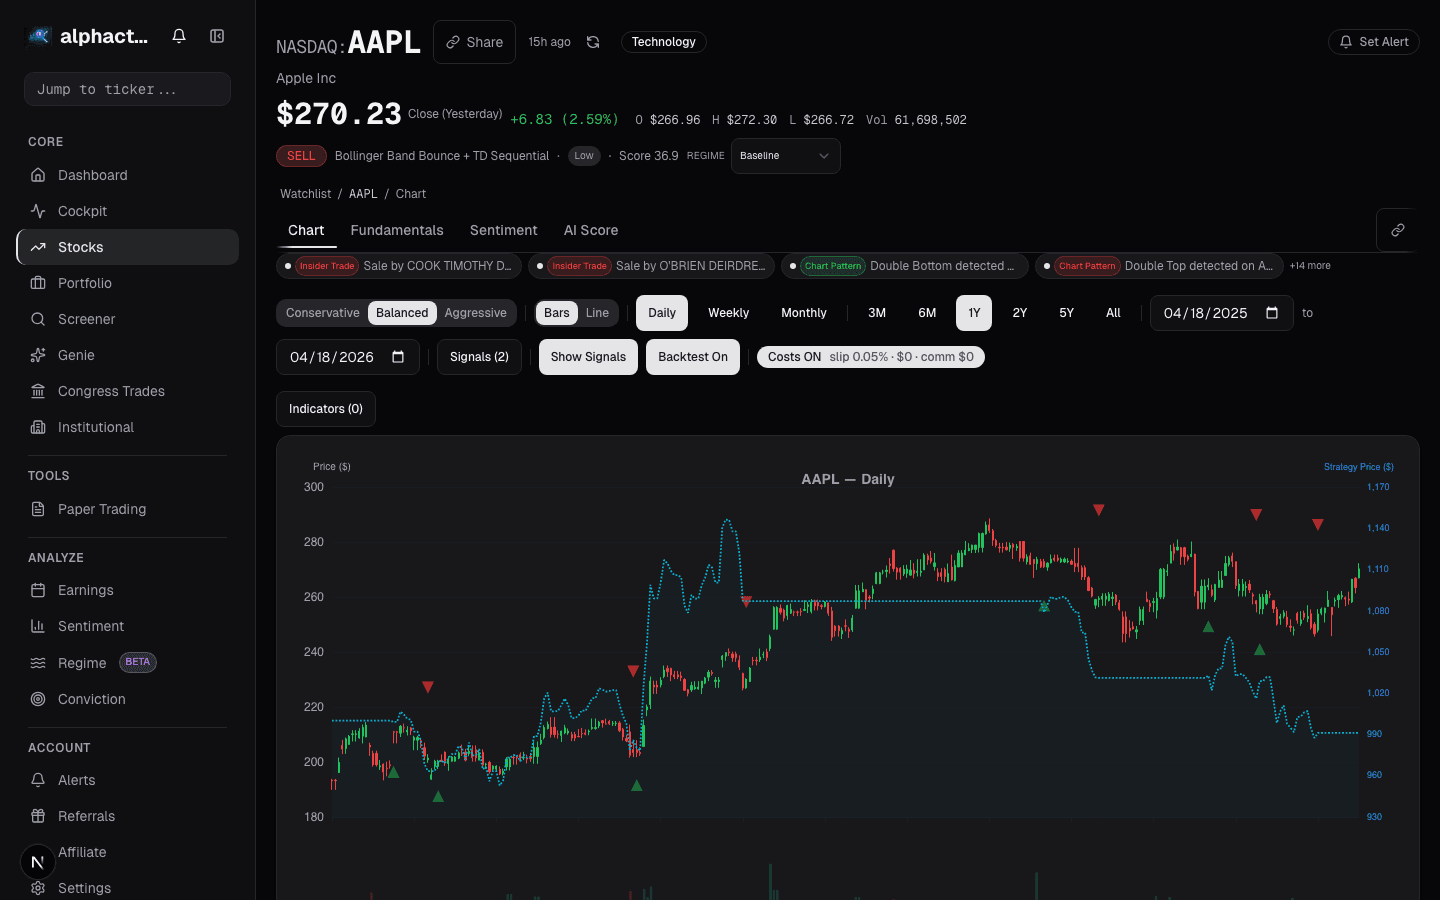
When I scan for trades, I do not start with candlestick patterns. I start with stocks at significant technical levels, things the universe scanner flags when price approaches key support or resistance with shifting momentum signals. Then I zoom into the daily chart on Alphactor charts and look for one of the five patterns above as a timing mechanism for my entry.
The pattern is the last filter, not the first. This flips the typical beginner approach on its head, but it is the only way I have found to make candlestick patterns consistently useful. The 60-80% success rates from the research only hold when the context is right. Strip the context away, and you are flipping coins with fancy names. You can backtest pattern-based entries with and without context filters to see the difference in your own data.
See it in the app
Live dashboard views that match this post. Each tile deep-links to the exact card.


Stocks mentioned
Related reading
News Annotations on the Chart: Tying Headlines to the Tape
A price move without a reason is just a squiggle you'll misread later. The News card annotates the chart with material headlines at their exact publication…
Why Stacking 5 Indicators on Your Chart Is Making You Worse
Most traders use too many indicators that say the same thing. Learn how to pick 2-3 complementary indicators and reduce signal noise.
Fibonacci Retracements
An honest look at Fibonacci retracements in trading, why they seem to work, when they actually help, and the 61.8% level's mixed track record.
Ichimoku Cloud: Complicated, but Here's What Matters
A practical breakdown of Ichimoku Cloud trading: which of the five lines actually matter and when simpler indicators do the job just as well.
MACD Beyond Crossovers
The MACD histogram reveals momentum shifts before the signal line cross. Here is how to read it properly and combine it with volume.
Support and Resistance
A practical guide to drawing support and resistance zones instead of precise lines, using volume to confirm levels and understanding what makes a level…
Ready to try alphactor.ai?
Validate your trading strategies with statistical credibility testing. Start free.
Get Started Free