Part of: Technical Analysis
Why Stacking 5 Indicators on Your Chart Is Making You Worse
Most traders use too many indicators that say the same thing. Learn how to pick 2-3 complementary indicators and reduce signal noise.
 Jake Morrison4 min read
The Chart That Changed My Mind
In 2017, I had a chart setup that looked like a control panel at NASA. RSI, MACD, Stochastic, CCI, and Williams %R, all stacked below the price chart. Plus two Bollinger Bands, three moving averages, and an ATR overlay. I thought more information meant better decisions. My account balance said otherwise.
The turning point was when a friend who had been profitable for years looked at my screen and asked: "Do you realize four of those indicators are telling you the exact same thing?" He was right. RSI, Stochastic, CCI, and Williams %R are all momentum oscillators. They all measure whether price has moved too far, too fast, relative to recent history. Having four of them is like asking four people who read the same newspaper for their "independent" opinions.
The Redundancy Problem
Most technical indicators fall into a few categories:
Trend indicators: Moving averages, MACD (trend component), ADX, Ichimoku Cloud. These tell you the direction and strength of the current trend.
Momentum oscillators: RSI, Stochastic, CCI, Williams %R, Rate of Change. These tell you whether price is overbought or oversold relative to recent movement.
Volatility indicators: Bollinger Bands, ATR, Keltner Channels. These measure how much price is moving, not which direction.
Volume indicators: OBV, Volume Profile, Accumulation/Distribution, VWAP. These measure participation and conviction behind price moves.
If you have three momentum oscillators on your chart, you do not have three confirmations. You have one signal measured three times. When RSI says overbought, Stochastic almost certainly agrees. That agreement feels like confirmation but it is just mathematical redundancy. It gives you false confidence.
Worse, on the rare occasions when redundant indicators disagree, usually due to slightly different calculation periods, it creates confusion exactly when you need clarity.
The 2-3 Indicator Framework
The fix is straightforward. Pick one indicator from each category that matters for your trading style, with a maximum of three total. Each indicator should tell you something the others cannot.
My current setup for swing trading:
- 21 EMA and 50 SMA (trend), Where is price relative to the trend? Is the short-term average above the long-term average?
- RSI 14 (momentum), Is the current move extended? Are there divergences forming?
- Volume bars with 20-period average (participation), Is the current move supported by above-average volume?

That is it. Three categories. Each one answers a different question. Trend tells me direction, RSI tells me whether the move is stretched, and volume tells me whether real money is behind it.
If you trade breakouts, you might swap RSI for ATR (to measure volatility expansion on the break) and keep volume. If you trade mean reversion, you might use Bollinger %B instead of a trend indicator. The specific choices depend on your strategy. The principle does not change: each indicator should provide non-redundant information.
Signal Confirmation vs. Signal Noise
There is a difference between genuine confirmation and noise that sounds like confirmation.
Genuine confirmation: Price breaks above resistance on high volume while RSI is rising from the 50 level. Trend, momentum, and volume are each telling you something different that collectively supports the same thesis.
False confirmation: RSI is above 70, Stochastic is above 80, and CCI is above 100. These three readings are mathematically related. The "confirmation" is an echo, not independent evidence.
The test I use: if removing one indicator would not change any of my recent trading decisions, it does not belong on my chart. I went through this exercise about two years ago and removed MACD entirely. Every signal it gave me, my moving averages and RSI already covered. Nothing changed about my trade selection. My charts got cleaner and my decision-making got faster.
How to Build Your Indicator Stack
Start with one indicator per category. Trade with it for a month. Track whether each indicator actually influenced at least one decision per week. If it did not influence a single decision, remove it.
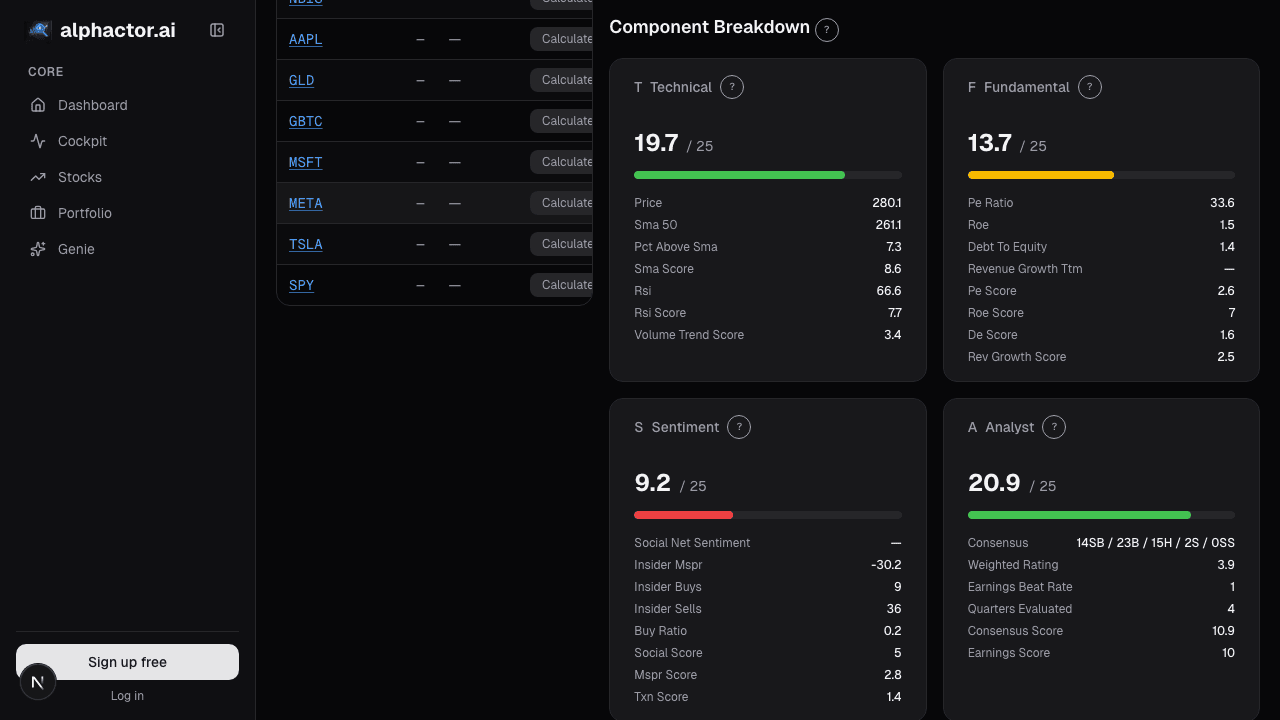
Alphactor's approach to this aligns with what I learned the hard way. The conviction scoring combines trend, momentum, and volume signals into a composite reading, which is exactly the multi-category framework described above, just automated. When I look at a stock's signal breakdown on Alphactor charts, I can see whether the trend component agrees with the momentum component and whether volume confirms. It saves me the step of eyeballing three separate indicators and synthesizing mentally.
But whether you use a platform or do it manually, the principle is the same: breadth of information categories beats depth within one category. One trend indicator, one momentum indicator, one volume indicator will give you better signal quality than five momentum oscillators agreeing with each other.
The Hardest Part Is Removing Things
Traders love adding tools. It feels productive. It feels like you are improving your process. But the traders I know who are consistently profitable tend to have the simplest charts. They made their money by knowing one or two setups deeply, not by having the most comprehensive indicator suite.
Take an honest look at your chart this week. For each indicator, ask: "What does this tell me that nothing else on my screen already covers?" If you cannot answer that clearly, it is clutter. Remove it, and give yourself the gift of cleaner decisions. Alphactor backtesting lets you test whether adding or removing an indicator from your strategy actually changes the results.
See it in the app
Live dashboard views that match this post. Each tile deep-links to the exact card.


Stocks mentioned
Related reading
ADX: How to Measure Whether a Trend Is Worth Trading
ADX measures trend strength, not direction. Here is how to use it with directional indicators to identify trending markets and avoid costly whipsaws in ranges.
The Bollinger Band Squeeze
Bollinger Band squeezes predict volatility expansions. Here is how to identify them, measure their intensity, and avoid the false breakouts.
5 Candlestick Patterns With Real Statistical Edge
Most candlestick patterns are noise. Research shows only a handful have measurable predictive power, and context matters more than the pattern itself.
Divergence Trading: The Signal That Saved My Account
How RSI divergence helped me catch a major market top, plus a practical guide to regular and hidden divergences with confirmation techniques.
Dual Momentum: Beating Buy-and-Hold for 40 Years
Gary Antonacci's dual momentum strategy combines absolute and relative momentum to deliver equity-like returns with bond-like drawdowns. Here are the numbers.
Fibonacci Retracements
An honest look at Fibonacci retracements in trading, why they seem to work, when they actually help, and the 61.8% level's mixed track record.
Ready to try alphactor.ai?
Validate your trading strategies with statistical credibility testing. Start free.
Get Started Free