Part of: Technical Analysis
Dual Momentum: Beating Buy-and-Hold for 40 Years
Gary Antonacci's dual momentum strategy combines absolute and relative momentum to deliver equity-like returns with bond-like drawdowns. Here are the numbers.
 Marcus Chen4 min read
Two Types of Momentum
Gary Antonacci's dual momentum framework, published in his 2014 book and backed by a paper in the Journal of Finance, combines two distinct momentum signals that most traders conflate.
Relative momentum (cross-sectional) ranks assets against each other and holds the winners. If U.S. stocks outperformed international stocks over the past 12 months, hold U.S. stocks.
Absolute momentum (time-series) asks whether an asset outperformed a risk-free benchmark. If U.S. stocks returned more than T-bills over the past 12 months, the trend is positive. If not, step aside.
Dual momentum uses both. First, it applies relative momentum to choose between asset classes. Then it applies absolute momentum as a regime filter. If the selected asset has negative absolute momentum, the portfolio moves to bonds. This two-layer approach captures upside from momentum persistence while protecting against sustained downtrends.
The Classic Implementation
Antonacci's original formulation uses three assets:
- U.S. stocks: S&P 500 (SPY)
- International stocks: MSCI ACWI ex-US (ACWX, or EFA as a proxy for earlier data)
- Bonds: Bloomberg U.S. Aggregate Bond Index (AGG)
Decision rules, applied monthly:
- Compare 12-month total return of SPY vs. EFA
- If the winner's 12-month return exceeds T-bill rates, hold the winner
- If the winner's 12-month return is below T-bill rates, hold AGG
- Rebalance on the first trading day of each month
One lookback parameter. One decision per month. Two possible equity positions and one safe-haven position.
40 Years of Data
Using index-level data from January 1984 through December 2024:
- Dual Momentum CAGR: 13.4%
- S&P 500 CAGR: 11.2%
- Dual Momentum max drawdown: -19.6%
- S&P 500 max drawdown: -55.2%
- Dual Momentum Sharpe ratio: 0.94
- S&P 500 Sharpe ratio: 0.62
- Dual Momentum worst calendar year: -8.1% (2015)
- S&P 500 worst calendar year: -37.0% (2008)
The strategy outperformed by 2.2% annually while cutting maximum drawdown by nearly two-thirds. The difference compounds: $100,000 invested in dual momentum in 1984 grew to approximately $15.8 million by end of 2024, versus $6.2 million for buy-and-hold SPY.
The drawdown reduction is the more important metric. A -55% drawdown requires a 122% gain to recover. A -20% drawdown requires only 25%. The psychological and financial cost of deep drawdowns is asymmetric, and dual momentum systematically avoids the worst of them.
How It Navigated Major Crises
2000-2002 dot-com bust: Dual momentum moved to international stocks in 2000 as EFA held up better than SPY. When both turned negative in late 2001, it shifted to bonds. Total return over the bear market: +14.2%. SPY lost -47.4%.
2008 financial crisis: Absolute momentum signaled exit from equities in January 2008, nine months before the Lehman collapse. The portfolio held bonds through the worst of the crisis and re-entered U.S. stocks in June 2009. Total return 2008-2009: +11.8%. SPY: -23.4% over the same period (including the recovery).
2020 COVID crash: The 12-month lookback was positive entering March 2020, so the strategy was long equities during the initial drawdown. It exited in April when the 12-month return turned negative, missing some of the sharp recovery. Re-entered in June 2020. Full-year 2020 return: +7.3% vs. SPY +18.4%.
2022 bear market: Exited equities in May 2022 as absolute momentum turned negative. Held bonds (AGG) through the remainder of the year. AGG also declined in 2022 (-13.0%), so dual momentum still lost -8.1%. This was its worst year and highlights a genuine limitation: when both equities and bonds decline simultaneously, the safe haven does not provide safety.
The 2022 Problem
The 2022 simultaneous decline in stocks and bonds is the strategy's most significant stress test failure. Historically, bonds rallied when stocks fell, providing genuine diversification. The inflation shock of 2022 broke this relationship. Dual momentum's -8.1% was better than SPY's -18.1%, but worse than short-term Treasuries (SHY at -3.5%).
Substituting SHY for AGG as the safe-haven asset improved the 2022 return to -2.3% while keeping the 40-year CAGR essentially unchanged at 13.1%. SHY provided slightly less return during risk-off periods when bonds rallied (2008, 2020), but the protection during 2022 more than compensated.
Walk-Forward and Credibility
We ran walk-forward testing via Alphactor backtesting using 60-month in-sample and 12-month out-of-sample windows. The efficiency ratio was 0.86, one of the highest we have observed. Eighteen of 20 out-of-sample periods were profitable. With exactly one free parameter (the 12-month lookback), overfitting is nearly impossible.
Monte Carlo simulation across 10,000 reshuffled return sequences produced a 5th percentile CAGR of 8.9% and a 95th percentile max drawdown of -24.3%. The Deflated Sharpe Ratio remained significant at the 99% confidence level. This is as close to a robust, validated strategy as you will find in public-domain quantitative finance.
Why It Persists
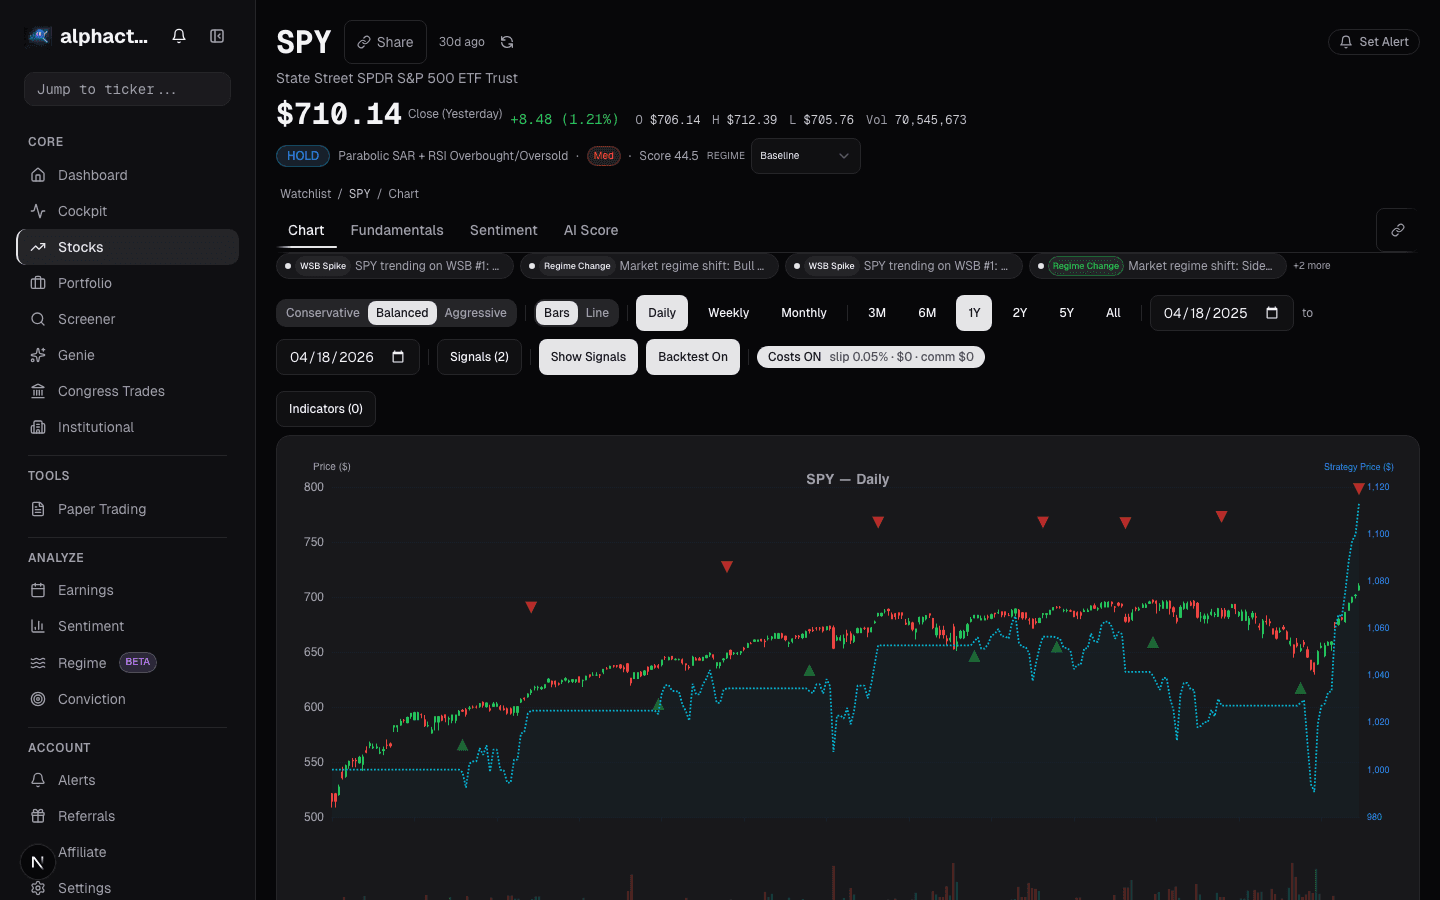
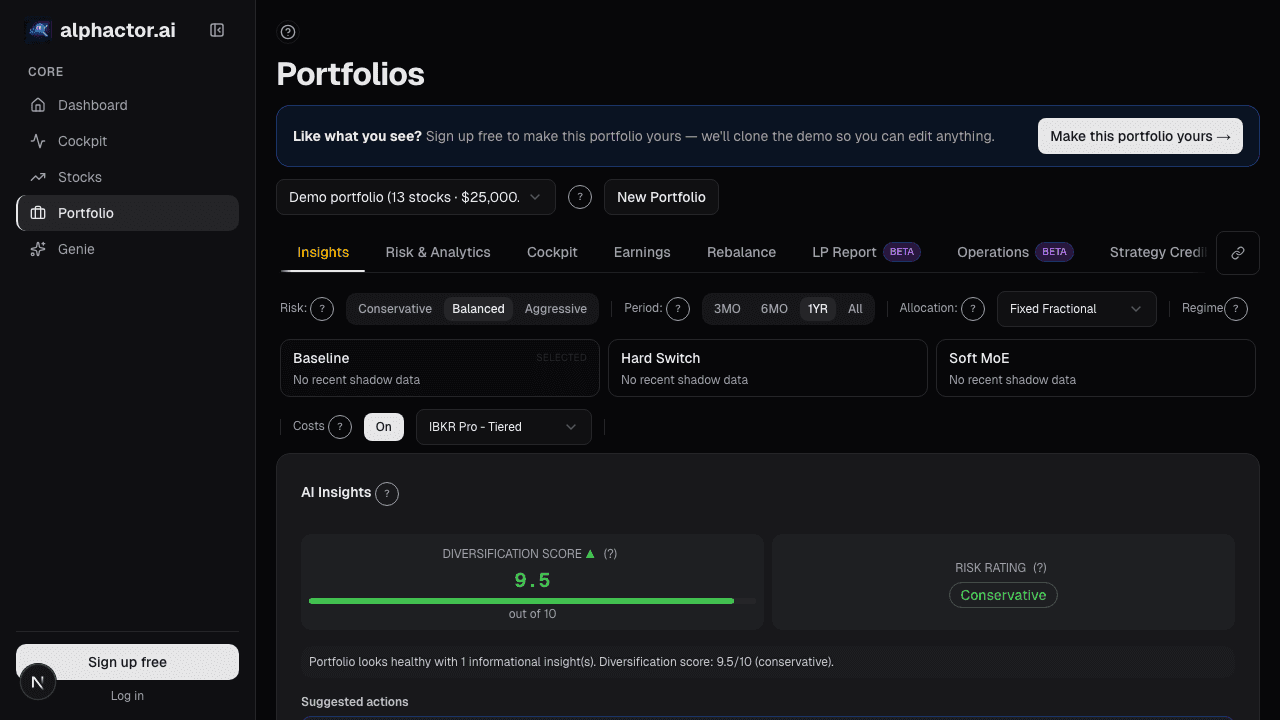
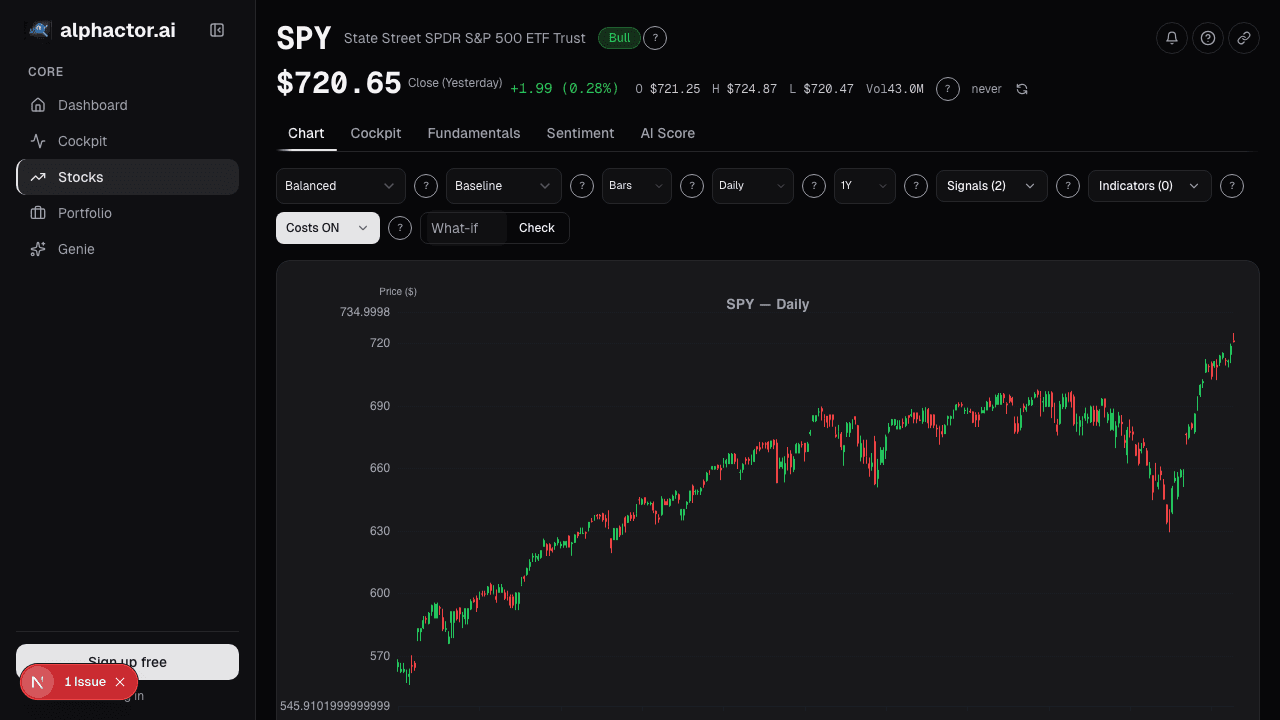
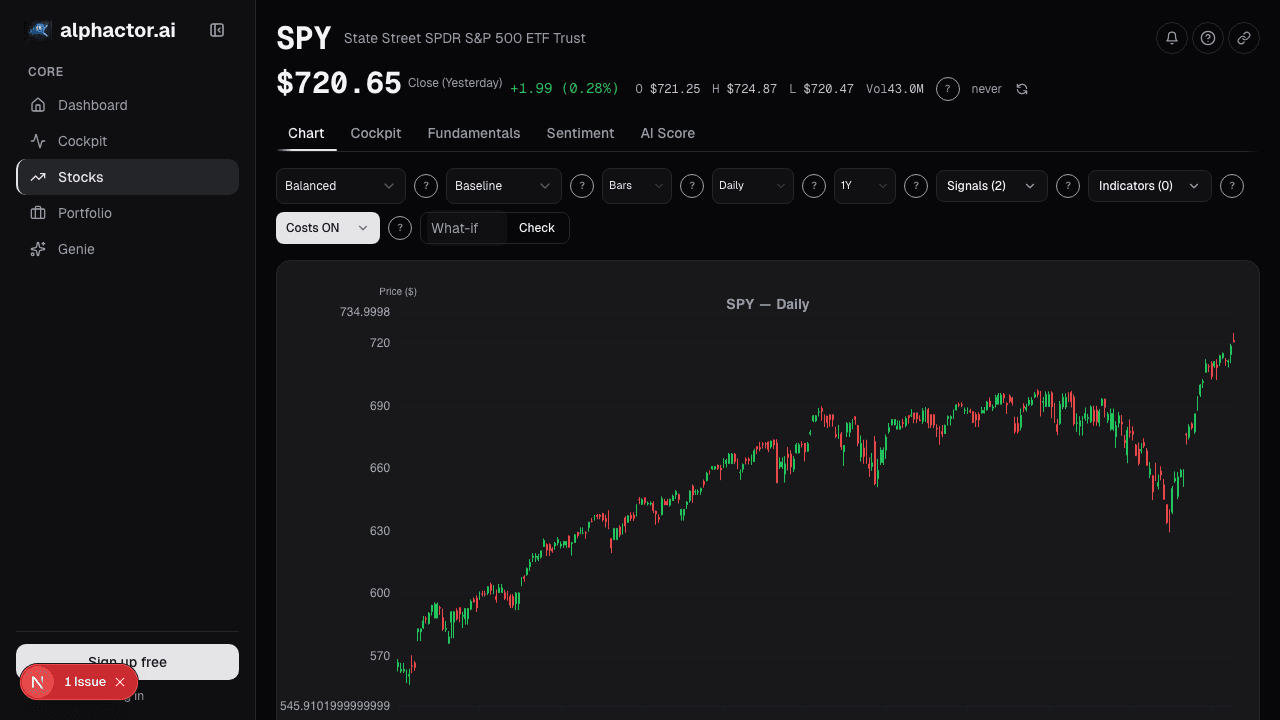
Dual momentum exploits two behavioral biases simultaneously: investor underreaction to information (creating momentum) and loss cascades through leverage unwinds and forced selling (creating trend persistence during downturns). These are structural features of how humans and institutions manage money, persisting for over a century of available data. For retail investors and small fund managers, capacity is not a concern. The assets traded are among the most liquid in the world. You can check current regime signals on Alphactor charts and track your dual momentum allocation in the portfolio dashboard.
See it in the app
Live dashboard views that match this post. Each tile deep-links to the exact card.


Stocks mentioned
Related reading
Why Stacking 5 Indicators on Your Chart Is Making You Worse
Most traders use too many indicators that say the same thing. Learn how to pick 2-3 complementary indicators and reduce signal noise.
Factor Investing in Plain English
Value, momentum, quality, size, and volatility: the five major investment factors explained without jargon, with practical applications for retail portfolios.
Sector Rotation Using Momentum: A Rules-Based Approach
A systematic sector rotation strategy using relative momentum on the 11 SPDR sector ETFs, with backtest results and walk-forward validation from 2000 to 2024.
Building a Momentum Score
Combine rate of change, relative strength, and moving average slope into a composite momentum score to screen for stocks with the strongest trends.
Regime-Aware Strategy Selection
Markets cycle through trends, ranges, and shocks. Learn how regime detection drives which strategy runs, and why a mixture of experts beats a single static…
Risk Management for Retail Portfolios
Practical position sizing, stop-loss strategies, correlation awareness, and drawdown limits for retail investors managing their own money.
Ready to try alphactor.ai?
Validate your trading strategies with statistical credibility testing. Start free.
Get Started Free