Part of: Technical Analysis
Sector Rotation Using Momentum: A Rules-Based Approach
A systematic sector rotation strategy using relative momentum on the 11 SPDR sector ETFs, with backtest results and walk-forward validation from 2000 to 2024.
 Marcus Chen4 min read
The Idea Behind Sector Rotation
Markets move in cycles. Technology leads in one phase, energy in another, utilities during risk-off periods. Discretionary traders try to anticipate these rotations by reading macro tea leaves. Systematic traders measure which sectors are already rotating and follow the trend.
The academic evidence for cross-sectional momentum (buying recent winners and selling recent losers) is among the strongest in empirical finance. Jegadeesh and Titman documented the effect in 1993, and it has been replicated across 40+ countries, multiple asset classes, and over a century of data. Applying it at the sector level is a natural extension.
Strategy Design
We used the 11 SPDR sector ETFs: XLB, XLC, XLE, XLF, XLI, XLK, XLP, XLRE, XLU, XLV, XLY. The rules are minimal:
- Ranking signal: 12-month total return, excluding the most recent month (the standard Jegadeesh-Titman formation period). The one-month skip avoids the well-documented short-term reversal effect.
- Selection: Hold the top 3 sectors by ranking signal.
- Rebalance: Monthly, on the first trading day.
- Regime filter: If SPY's 12-month return is negative, move entirely to SHY (short-term Treasuries).
- Position sizing: Equal weight across held sectors (33.3% each, or 100% SHY in risk-off mode).
- Period: January 2000 through December 2024 (25 years).
Three parameters: the lookback period, the number of sectors held, and the regime threshold. Keeping the parameter count low is deliberate. Every additional parameter is a degree of freedom that can be exploited by overfitting.
The Numbers
Over 25 years, the strategy produced:
- CAGR: 11.2%
- Maximum drawdown: -18.4% (2022)
- Sharpe ratio: 0.82
- Win rate (monthly): 62.3%
- Time in market: 71% equity, 29% Treasuries
SPY buy-and-hold returned approximately 7.5% CAGR over the same period with a -55.2% maximum drawdown during the 2008 financial crisis. The sector rotation strategy avoided the worst of 2008 because the regime filter moved to Treasuries after SPY's 12-month return turned negative in early 2008.
The 2022 drawdown of -18.4% occurred because the regime filter lagged. SPY's trailing 12-month return did not turn negative until late in the decline, so the strategy was long energy (XLE) and healthcare (XLV) during much of the downturn. XLE actually gained 59% in 2022, which cushioned the blow. Without the energy allocation, the drawdown would have been worse.
Which Sectors Appeared Most
Over 25 years, the top 3 ranking favored:
- XLK (Technology): Held 47% of months
- XLY (Consumer Discretionary): Held 34% of months
- XLE (Energy): Held 28% of months
- XLF (Financials): Held 22% of months
Technology dominated because it had the strongest secular trend over this period. The strategy naturally overweighted the leading sectors without any fundamental analysis or macro forecasting. It simply followed price.
Walk-Forward Testing
We ran walk-forward analysis using 60-month in-sample windows and 12-month out-of-sample windows, rolling forward annually. The Alphactor backtesting walk-forward engine computed an efficiency ratio of 0.74 across 20 out-of-sample periods. Sixteen of the 20 periods were profitable. The four losing periods aligned with regime transitions where the filter lagged the turn by one to two months.
The efficiency ratio of 0.74 is solid for a monthly strategy. It means the out-of-sample performance retained roughly three-quarters of the in-sample edge. Strategies that score below 0.50 on this metric are typically curve-fitted and not worth deploying.
Parameter Sensitivity
We tested lookback periods from 3 to 18 months and top-N selections from 1 to 5 sectors. The results were encouraging for robustness:
- Lookback periods between 6 and 12 months all produced CARs between 9.8% and 11.5%
- Holding 2 to 4 sectors produced Sharpe ratios between 0.74 and 0.85
- Only extreme parameters (1-month lookback, holding 1 sector) showed significant degradation
This parameter stability is what you want to see. When a strategy only works at one specific parameter combination, it is almost certainly overfit. When a range of reasonable parameters all produce similar results, the underlying effect is more likely real. Alphactor's optimization heatmaps make this easy to visualize: you plot CAGR or Sharpe across a parameter grid and look for broad plateaus, not narrow peaks.
Practical Considerations
Monthly rebalancing across liquid sector ETFs generates minimal transaction costs. Average monthly turnover was 38%, meaning roughly one sector swap per month. At ETF bid-ask spreads of $0.01-0.02 and commissions near zero at modern brokers, friction is negligible for accounts under $10 million.
The regime filter is the single most important component. Without it, the strategy suffered a -42.1% drawdown in 2008. With it, the worst drawdown across 25 years was -18.4%. A simple binary filter (in or out based on trailing 12-month return) is not sophisticated, but it captured the majority of the benefit. More complex regime models added marginal improvement at the cost of additional parameters and overfitting risk.
Systematic sector rotation is not about predicting which sectors will lead. It is about measuring which sectors are already leading and riding the trend until the evidence changes. The edge comes from consistent execution over hundreds of rebalancing cycles, not from any single allocation decision. Use the universe scanner to identify which sectors are currently leading by relative momentum.
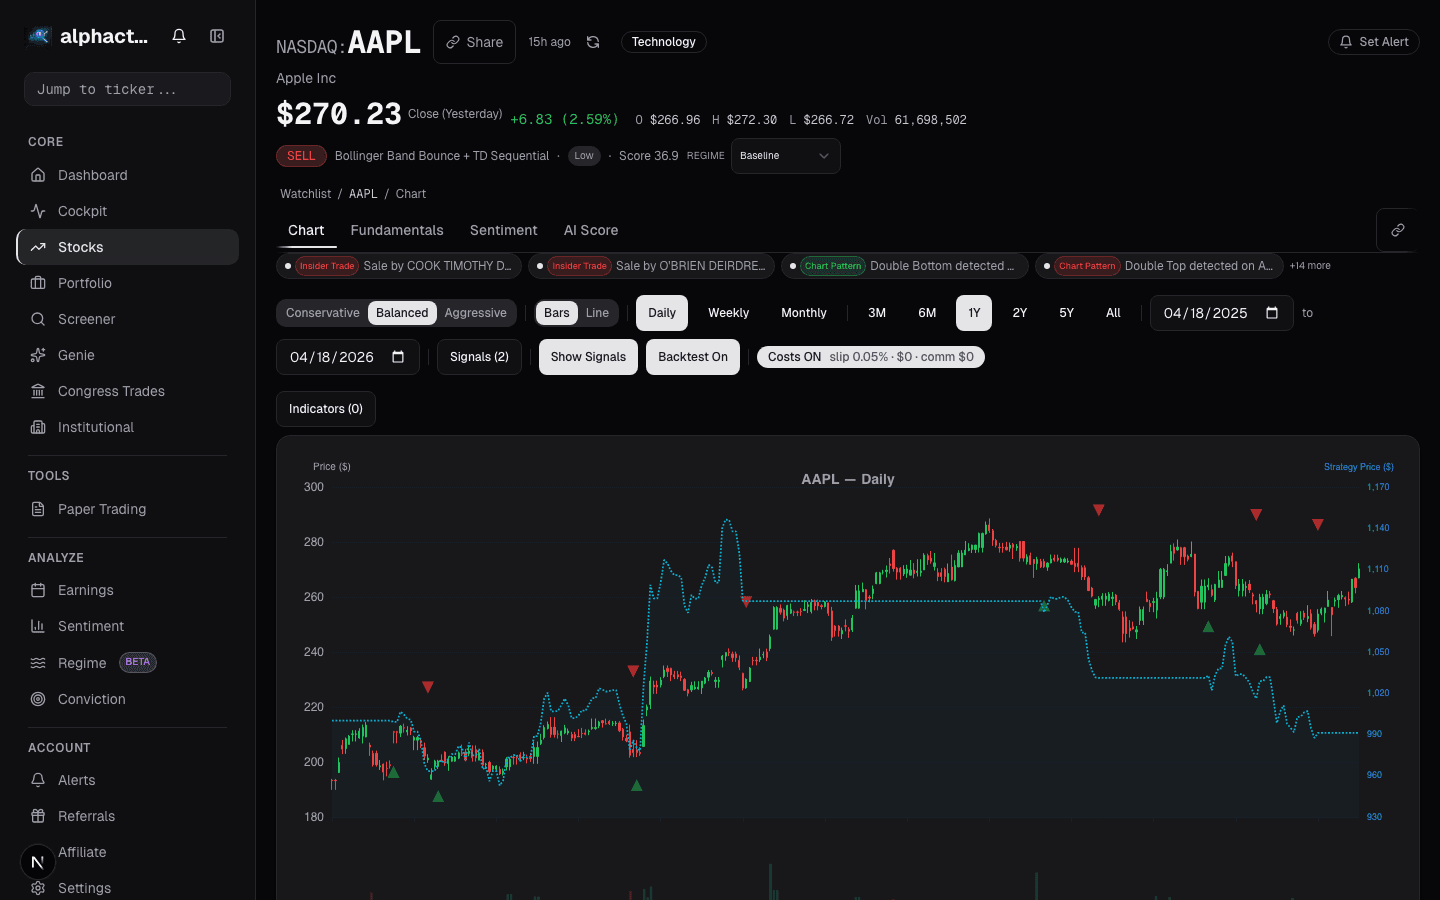
See it in the app
Live dashboard views that match this post. Each tile deep-links to the exact card.


Stocks mentioned
Related reading
Why Stacking 5 Indicators on Your Chart Is Making You Worse
Most traders use too many indicators that say the same thing. Learn how to pick 2-3 complementary indicators and reduce signal noise.
Dual Momentum: Beating Buy-and-Hold for 40 Years
Gary Antonacci's dual momentum strategy combines absolute and relative momentum to deliver equity-like returns with bond-like drawdowns. Here are the numbers.
Factor Investing in Plain English
Value, momentum, quality, size, and volatility: the five major investment factors explained without jargon, with practical applications for retail portfolios.
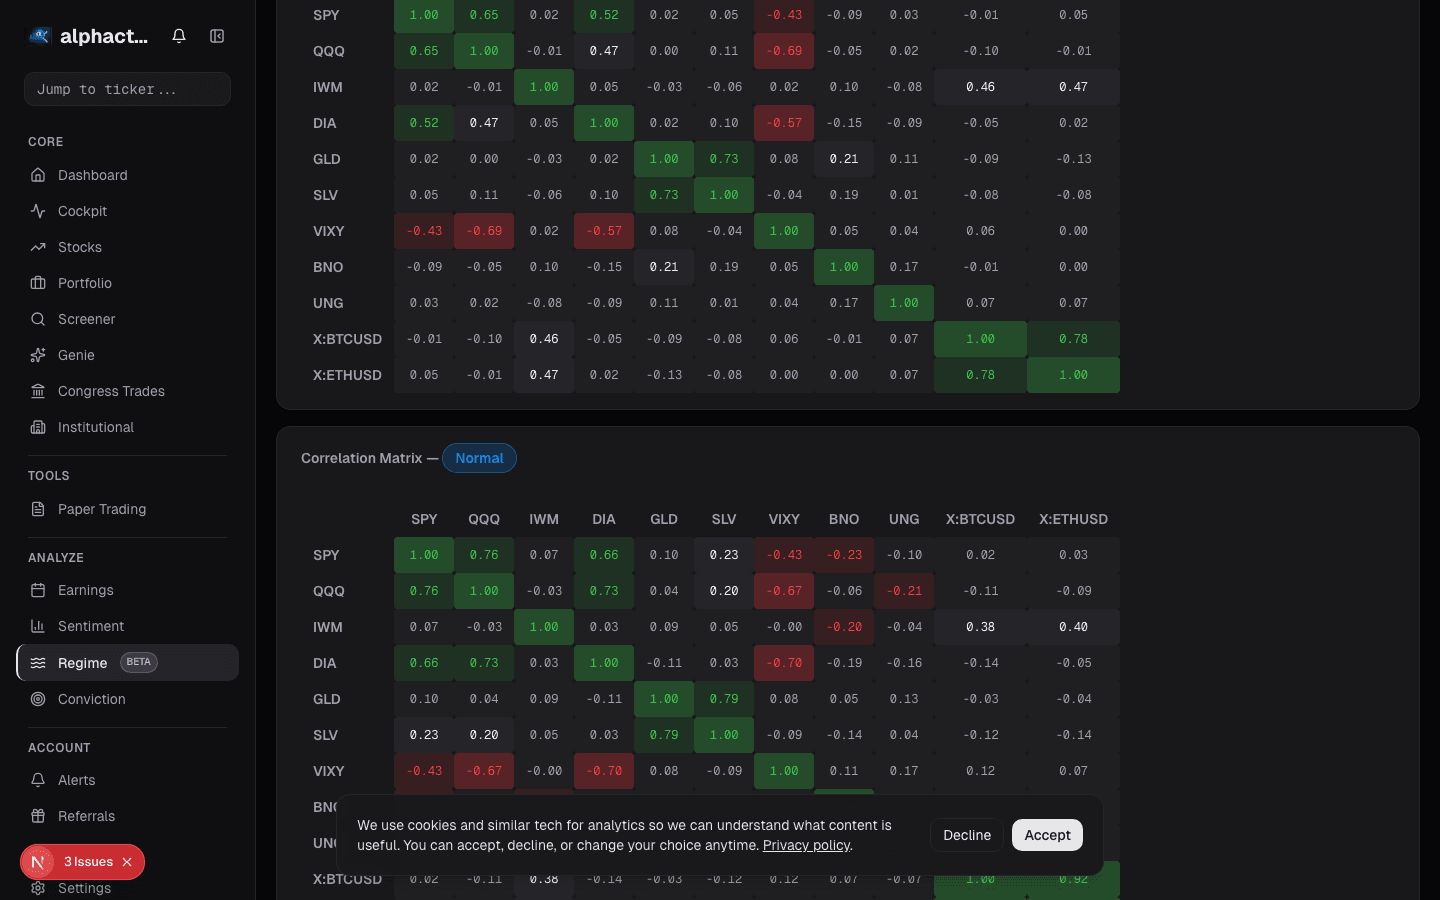
Regime-Aware Strategy Selection
Markets cycle through trends, ranges, and shocks. Learn how regime detection drives which strategy runs, and why a mixture of experts beats a single static…
Risk Management for Retail Portfolios
Practical position sizing, stop-loss strategies, correlation awareness, and drawdown limits for retail investors managing their own money.
Ready to try alphactor.ai?
Validate your trading strategies with statistical credibility testing. Start free.
Get Started Free