ADX: How to Measure Whether a Trend Is Worth Trading
ADX measures trend strength, not direction. Here is how to use it with directional indicators to identify trending markets and avoid costly whipsaws in ranges.
 Marcus Chen4 min read
The Most Important Question in Trading
Before you trade any setup, you need to answer one question: is this market trending or ranging? Get it wrong and even a perfect signal will lose money. Trend-following signals in a range produce whipsaws. Mean-reversion signals in a trend produce gap-outs.
ADX, the Average Directional Index, is the best tool I know for answering this question quantitatively. It does not tell you which direction. It tells you whether direction exists at all.
What ADX Measures
ADX is derived from the smoothed averages of the difference between +DI and -DI (directional indicators) over a lookback period, usually 14 days.
+DI (Positive Directional Indicator) measures upward price movement.
-DI (Negative Directional Indicator) measures downward price movement.
ADX measures the strength of the trend regardless of direction. It is always positive.
The key thresholds:
- ADX below 20: No meaningful trend. The market is ranging or choppy. Mean-reversion strategies (stochastic, RSI overbought/oversold) work best.
- ADX 20-25: A trend may be emerging but is not yet confirmed. Transitional zone.
- ADX 25-40: A solid trend is in place. Trend-following strategies (moving average crossovers, breakouts) work best.
- ADX above 40: Strong trend. Rare and powerful. These are the moves where trend followers make their year.
- ADX above 50: Extremely strong trend. Also a warning that the trend is mature and may be nearing exhaustion.
ADX Direction vs ADX Level
A falling ADX does not mean the market is falling. It means the trend, whatever the direction, is weakening.
A stock can fall from $150 to $120 with a rising ADX (strong downtrend) and then continue falling from $120 to $110 with a declining ADX (weakening but still declining). The decline is not over. It is just losing steam. "Trend weakening" and "trend reversing" are not synonyms.

Using +DI and -DI for Direction
ADX tells you the strength. The directional indicators tell you the direction.
+DI above -DI: The trend is up. -DI above +DI: The trend is down.
The most reliable signals combine ADX level with DI direction:
High-probability long: +DI crosses above -DI while ADX is rising and above 20. This signals both trend emergence and bullish direction.
High-probability short: -DI crosses above +DI while ADX is rising and above 20.
Low-probability signal: Any DI crossover while ADX is below 20. These crossovers happen frequently in ranging markets and are mostly noise.
AMZN in November 2023 gave a textbook setup. +DI crossed above -DI on November 3 with ADX at 22 and rising. ADX reached 38 by mid-December as the stock rallied from $136 to $155. The DI crossover plus rising ADX combination correctly identified a trending move early.
The ADX Regime Framework
I use ADX to divide my trading approach into two distinct regimes:
Trending regime (ADX > 25 and rising):
- Use momentum indicators: MACD, moving average crossovers
- Trail stops using ATR multiples
- Add to winning positions on pullbacks to the 20-day EMA
- Avoid selling overbought/oversold readings against the trend
- Patience is the strategy. Let the trend work.
Ranging regime (ADX < 20):
- Use oscillators: stochastic, RSI
- Buy at support, sell at resistance
- Take profits quickly. Do not hold for a "breakout" that may not come.
- Keep position sizes smaller because ranges can break in either direction
- Bollinger Bands and mean-reversion setups shine here
The transition zone (ADX 20-25) requires the most judgment. I generally default to ranging behavior until ADX clearly breaks above 25 with confirming DI signals.
ADX and Volatility Breakouts
One of ADX's most practical applications is confirming volatility breakouts. When a stock has been in a tight range (ADX below 20, Bollinger Bands squeezed) and then breaks out, ADX should start rising if the breakout is genuine.
If price breaks out of a range but ADX stays flat or below 20, the breakout is suspect. It may lack the directional conviction to sustain. The universe scanner can help you filter for stocks where ADX is rising above 25, narrowing your focus to names in confirmed trends.
GOOG in October 2023 broke out of a three-week range with ADX simultaneously rising from 16 to 28 over four trading days. Real breakout, sustained move. Contrast that with PYPL in August 2023, where price broke above $68 resistance but ADX remained at 14. The breakout failed within a week, and PYPL returned to $62.
Common ADX Mistakes
Treating ADX as a directional indicator. ADX rising does not mean the market is rising. It means the trend is intensifying.
Exiting because ADX is declining. Many profitable trends persist for weeks after ADX begins to fall. Use price-based stops for exits, not ADX level.
Waiting for ADX above 40 to act. By the time ADX reaches 40, a large portion of the move has already occurred. The sweet spot is ADX crossing above 25 with confirming DI signals.
Alphactor charts display ADX alongside momentum and oscillator readings, making it clear whether the current market regime favors trend-following or mean-reversion setups. The conviction score factors in trend strength, so a bullish signal in a confirmed trend carries more weight than the same signal in a range.
The Filter That Fixes Everything
ADX does not generate trade signals. It tells you which signals to trust. That distinction makes it one of the most practical indicators available. Apply it as a filter to whatever system you already use, and you will eliminate a meaningful percentage of false signals.
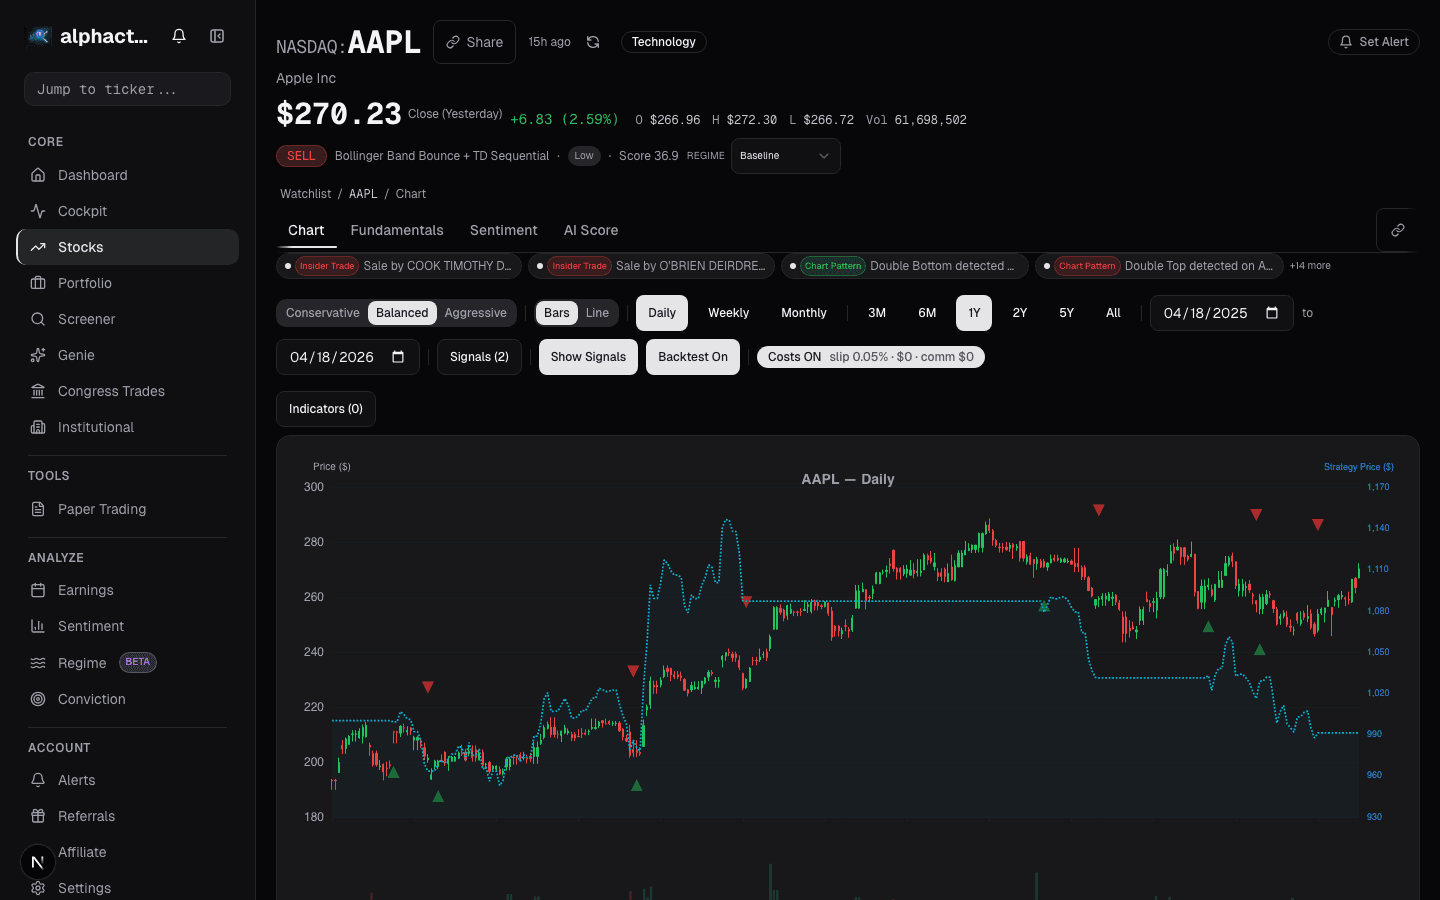
See it in the app
Live dashboard views that match this post. Each tile deep-links to the exact card.


Stocks mentioned
Related reading
ATR for Position Sizing
How Average True Range normalizes risk across stocks, sets intelligent stop losses, and determines position size based on volatility, not gut feeling.
Why Stacking 5 Indicators on Your Chart Is Making You Worse
Most traders use too many indicators that say the same thing. Learn how to pick 2-3 complementary indicators and reduce signal noise.
Divergence Trading: The Signal That Saved My Account
How RSI divergence helped me catch a major market top, plus a practical guide to regular and hidden divergences with confirmation techniques.
Fibonacci Retracements
An honest look at Fibonacci retracements in trading, why they seem to work, when they actually help, and the 61.8% level's mixed track record.
Market Breadth: The Health Check Most Investors Skip
How advance-decline lines, new highs-lows, and participation rates reveal whether a rally is built on solid ground or propped up by a handful of stocks.
VWAP: The Institutional Benchmark Retail Traders Overlook
VWAP is the price benchmark institutions use to measure execution quality. Here is why it matters for retail traders and how anchored VWAP extends it to…
Ready to try alphactor.ai?
Validate your trading strategies with statistical credibility testing. Start free.
Get Started Free