VWAP: The Institutional Benchmark Retail Traders Overlook
VWAP is the price benchmark institutions use to measure execution quality. Here is why it matters for retail traders and how anchored VWAP extends it to…
 Jake Morrison4 min read
The Benchmark Nobody Explains
Walk onto any institutional trading desk and ask how they evaluate execution quality. The answer is almost always the same: VWAP. Volume Weighted Average Price. If a portfolio manager tells a trader to buy 500,000 shares of MSFT "at VWAP or better," the trader's job is to get an average fill price at or below the day's VWAP.
This makes VWAP fundamentally different from most technical indicators. It is not a theoretical construct. It is an actual price level where real institutional money measures success or failure. That gives it a weight that a 14-period RSI or a Bollinger Band simply does not have.
How VWAP Is Calculated
VWAP = Cumulative (Price x Volume) / Cumulative Volume, calculated continuously from the market open.
Early in the day, each new print heavily influences VWAP. By 2:00 PM, VWAP is relatively stable because so much volume has already accumulated. This means VWAP is most dynamic in the first two hours of trading. By mid-afternoon, it becomes more of a reference level than a trading signal.
VWAP as Support and Resistance
Intraday, VWAP acts as a dynamic support or resistance level because institutional algorithms are anchored to it.
Price above VWAP: Institutions that need to buy have not yet achieved their VWAP target, so they buy dips toward VWAP. This creates support.
Price below VWAP: Buyers from earlier are underwater. Institutions with sell programs may continue selling. VWAP acts as resistance.
On a typical day in AAPL or MSFT, price touches VWAP and bounces 8-12 times. Not magic. Billions of dollars of algorithmic trading using VWAP as their benchmark. On February 15, 2024, AAPL's VWAP established at $183.40 by 10:30 AM and held as support three times across the session.
Trading Around VWAP
The simplest VWAP strategy is directional: trade in the direction of VWAP's slope and use VWAP as your risk level.
Long setup: Price pulls back to VWAP from above. VWAP is sloping upward. Buy near VWAP with a stop $0.50-1.00 below it (scale this to the stock's ATR). Target the day's high or the upper standard deviation band.
Short setup: Price rallies to VWAP from below. VWAP is sloping downward. Short near VWAP with a stop above it. Target the day's low or the lower deviation band.
The win rate improves when you add a gap filter: only take long setups when the stock gapped up at open, short setups when it gapped down. The gap tells you bias. VWAP gives you the entry level.
VWAP Standard Deviation Bands
Most platforms display bands at 1 and 2 standard deviations above and below VWAP. The +/- 1 SD bands capture roughly 68% of the day's price action. The +/- 2 SD bands capture about 95%.
When price reaches the 2 SD band, it is statistically extended. On a normal day, that is a reasonable level to take profits or watch for mean-reversion. But on trending days driven by news or earnings, price can camp at the 2 SD band for hours. Mean-reversion to VWAP will fail on those days.
Anchored VWAP: Extending VWAP to Swing Trading
Standard VWAP resets each day. Anchored VWAP lets you start the calculation from any point you choose: an earnings date, a gap, a significant low, or any event you consider meaningful.
Anchored VWAP from earnings: Anchor VWAP to the first bar of the post-earnings session. This tracks the average price every buyer since the report actually paid. Above anchored VWAP, the average buyer is profitable. Below, they are underwater.
NVDA after its May 2024 earnings is a textbook case. Anchored VWAP from the post-earnings open at $1,050 acted as support for three weeks. Every pullback to the anchored VWAP level found buyers. The level held until the next earnings cycle.
Anchored VWAP from a swing low: Start the calculation from a significant bottom. This tracks the average cost basis of everyone who bought since that low. As long as price stays above this level, the trend from that low is intact.
VWAP Limitations
VWAP is a daily indicator by nature. It resets at the open and has no information about prior days. This makes it useless for multi-day position sizing or stop-loss placement. Use ATR or price-based levels for those decisions.
VWAP also loses meaning in low-volume environments: pre-market, after-hours, holiday sessions. On stocks with average daily volume under 1 million shares, VWAP is less relevant because institutional algorithmic trading at VWAP is minimal. The self-reinforcing dynamic that makes VWAP powerful on AAPL or SPY does not exist on thinly traded names.
Why Retail Traders Should Care
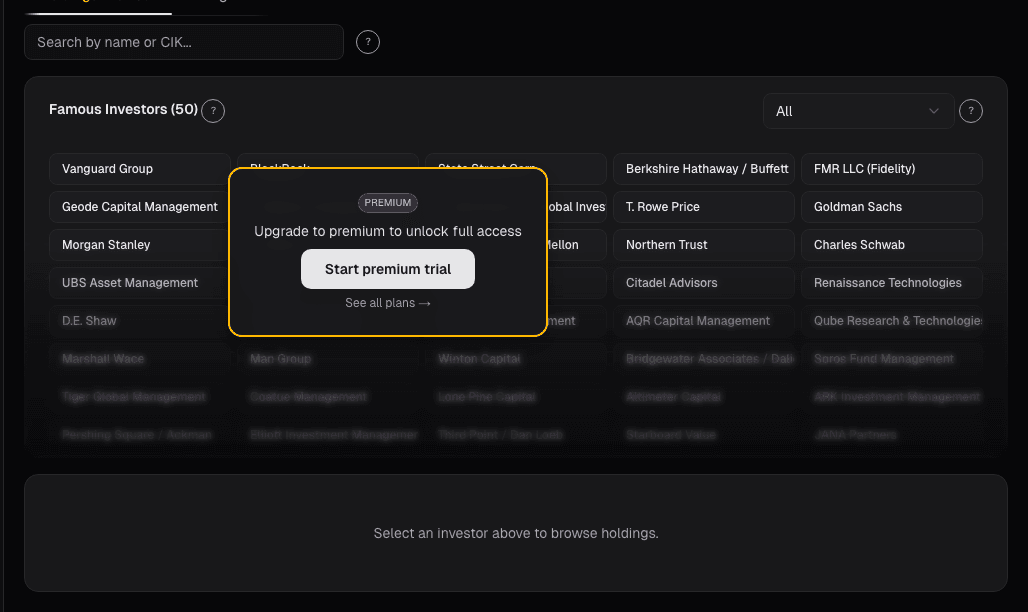
You are not trading 500,000 shares of MSFT. But the institutions who are create predictable price behavior around VWAP all day long. You can position ahead of that flow. Same reason a small boat pays attention to the wake of a cargo ship. The 13F explorer shows you which institutions hold large positions in a stock, giving you insight into who is generating that VWAP-anchored flow.
Alphactor charts surface VWAP-based analysis alongside momentum indicators, giving both intraday and swing traders context on where institutional flow is concentrated.
See it in the app
Live dashboard views that match this post. Each tile deep-links to the exact card.


Stocks mentioned
Related reading
ADX: How to Measure Whether a Trend Is Worth Trading
ADX measures trend strength, not direction. Here is how to use it with directional indicators to identify trending markets and avoid costly whipsaws in ranges.
Why Stacking 5 Indicators on Your Chart Is Making You Worse
Most traders use too many indicators that say the same thing. Learn how to pick 2-3 complementary indicators and reduce signal noise.
Divergence Trading: The Signal That Saved My Account
How RSI divergence helped me catch a major market top, plus a practical guide to regular and hidden divergences with confirmation techniques.
Fibonacci Retracements
An honest look at Fibonacci retracements in trading, why they seem to work, when they actually help, and the 61.8% level's mixed track record.
Market Breadth: The Health Check Most Investors Skip
How advance-decline lines, new highs-lows, and participation rates reveal whether a rally is built on solid ground or propped up by a handful of stocks.
Ready to try alphactor.ai?
Validate your trading strategies with statistical credibility testing. Start free.
Get Started Free