Blog /
#technical-analysis
9 posts tagged technical-analysis.
9 posts
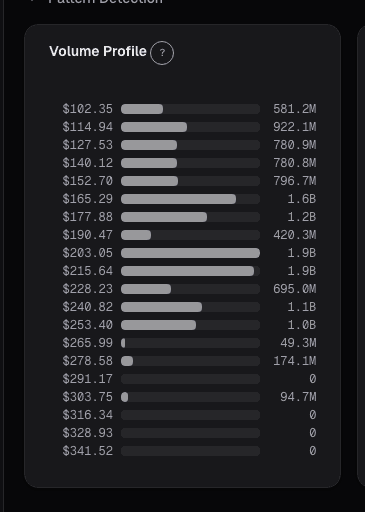
Support and Resistance
A practical guide to drawing support and resistance zones instead of precise lines, using volume to confirm levels and understanding what makes a level…
5 Candlestick Patterns With Real Statistical Edge
Most candlestick patterns are noise. Research shows only a handful have measurable predictive power, and context matters more than the pattern itself.
Why Stacking 5 Indicators on Your Chart Is Making You Worse
Most traders use too many indicators that say the same thing. Learn how to pick 2-3 complementary indicators and reduce signal noise.

Fibonacci Retracements
An honest look at Fibonacci retracements in trading, why they seem to work, when they actually help, and the 61.8% level's mixed track record.
Ichimoku Cloud: Complicated, but Here's What Matters
A practical breakdown of Ichimoku Cloud trading: which of the five lines actually matter and when simpler indicators do the job just as well.
Stochastic Oscillator: When It Works and When to Ignore It
The stochastic oscillator thrives in ranging markets and fails in trends. Here is how to use ADX to know which regime you are in and when to trust the signal.
SMA vs EMA vs WMA: Which Moving Average Actually Matters
A practical comparison of simple, exponential, and weighted moving averages with backtested data showing when each type works and when it does not.

MACD Beyond Crossovers
The MACD histogram reveals momentum shifts before the signal line cross. Here is how to read it properly and combine it with volume.
RSI: The Most Misused Indicator in Retail Trading
Why buying at RSI 30 and selling at 70 loses money, and what RSI actually tells you about momentum, divergences, and failure swings.