Part of: Technical Analysis
RSI: The Most Misused Indicator in Retail Trading
Why buying at RSI 30 and selling at 70 loses money, and what RSI actually tells you about momentum, divergences, and failure swings.
 Jake Morrison4 min read
The 30/70 Trap
Here is what most retail traders do with RSI: they buy when it drops below 30 and sell when it rises above 70. Simple. Clean. And frequently wrong.
I ran a basic backtest on S&P 500 components from 2015 to 2024. Buying every RSI(14) cross below 30 and selling at 70 produced a win rate of 52% with an average gain of 4.1% on winners versus an average loss of 6.8% on losers. Negative expected value. You would have been better off flipping a coin and at least avoiding the transaction costs.
The problem is not RSI itself. It is a perfectly fine momentum oscillator. The problem is that most people treat it as a binary buy/sell signal when it was designed to measure something more nuanced: the speed and magnitude of price changes.
What RSI Actually Measures
Welles Wilder designed RSI to show when price momentum is accelerating or decelerating. An RSI of 70 does not mean "overbought." It means upward momentum has been strong relative to downward momentum over the lookback period. That is not the same thing. AAPL spent 47 trading days above RSI 70 during its run from $150 to $198 in late 2023. Selling at the first touch of 70 would have left 25% of the move on the table.
In strong trends, RSI hangs out at extreme levels. That is it doing its job. It is telling you momentum is persistent, not that a reversal is imminent.
Divergences: Where RSI Gets Interesting
The most reliable RSI signal is not an overbought/oversold reading. It is divergence between price and the indicator.
Bearish divergence: Price makes a higher high, but RSI makes a lower high. This happened on NVDA in March 2024 before a 15% pullback. Price was still climbing, but momentum was fading. Fewer buyers were willing to chase at higher prices.
Bullish divergence: Price makes a lower low, but RSI makes a higher low. META showed this pattern in November 2022 near $88, right before a rally that eventually took it past $500. The selling pressure was exhausting itself even as price ground lower.
Divergences are not instant trade signals. They are warnings. Think of them as the check engine light on your dashboard. You do not immediately pull over, but you start paying attention and looking for confirmation.
Failure Swings: The Signal Most People Miss
Wilder himself said failure swings were the strongest RSI signal, yet barely anyone uses them.
A bullish failure swing works like this:
- RSI drops below 30
- RSI bounces above 30
- RSI pulls back but stays above 30
- RSI breaks above the bounce high from step 2
The key is step 3. RSI refuses to make a new low even as price may still be declining. It is showing you that selling momentum has dried up before price confirms it.
A bearish failure swing is the mirror image above 70. RSI hits 70+, pulls back, rallies again but fails to exceed the prior RSI high, then breaks below the pullback low.
Failure swings on XOM in September 2023 flagged a top at $118 that preceded a $12 decline. The signal fired two days before the price breakdown.
When RSI Works and When It Lies
RSI works best in ranging markets. When a stock is bouncing between defined support and resistance, overbought and oversold readings have real predictive value. The key is knowing which regime you are in before applying the indicator.
RSI lies in strong trends. During the 2020-2021 bull run, RSI stayed above 50 on QQQ for months at a time. Every dip to 40 was a buying opportunity, not a sell signal. Traders who shorted "overbought" RSI readings got destroyed.
A simple regime filter: check if the 50-day moving average is above the 200-day. If it is, treat RSI pullbacks to 40-50 as potential entries rather than waiting for 30. If the 50-day is below the 200-day, the traditional 30/70 levels become more relevant. You can test how RSI performs across different regimes using Alphactor backtesting.
Practical RSI Settings
The default 14-period RSI is fine for swing trading. But it is not sacred.
Shorter periods (7-9) make RSI more sensitive. Useful for intraday or very short-term swing trades, but the noise increases substantially. I have seen traders on 5-period RSI generate signals every other day, most of them meaningless.
Longer periods (21-28) smooth out the noise and work better for position trading. A 21-period RSI divergence on a weekly chart is a much stronger signal than a 14-period divergence on a daily chart, simply because it represents more data.
In Alphactor charts, you can see RSI divergences flagged alongside other momentum indicators. The value is not any single reading but how RSI aligns with the broader signal picture. An RSI divergence that coincides with declining volume and a MACD histogram rollover is a materially different signal than an RSI divergence on its own.
The Bottom Line
RSI is a momentum gauge, not a trading system. Stop using it as a standalone buy/sell trigger. Start using it to ask better questions: Is momentum confirming the trend? Is there a divergence forming? Has a failure swing completed?
The difference between retail traders who lose money with RSI and professionals who use it effectively is not the indicator settings or the timeframe. It is whether they understand what the number actually represents.
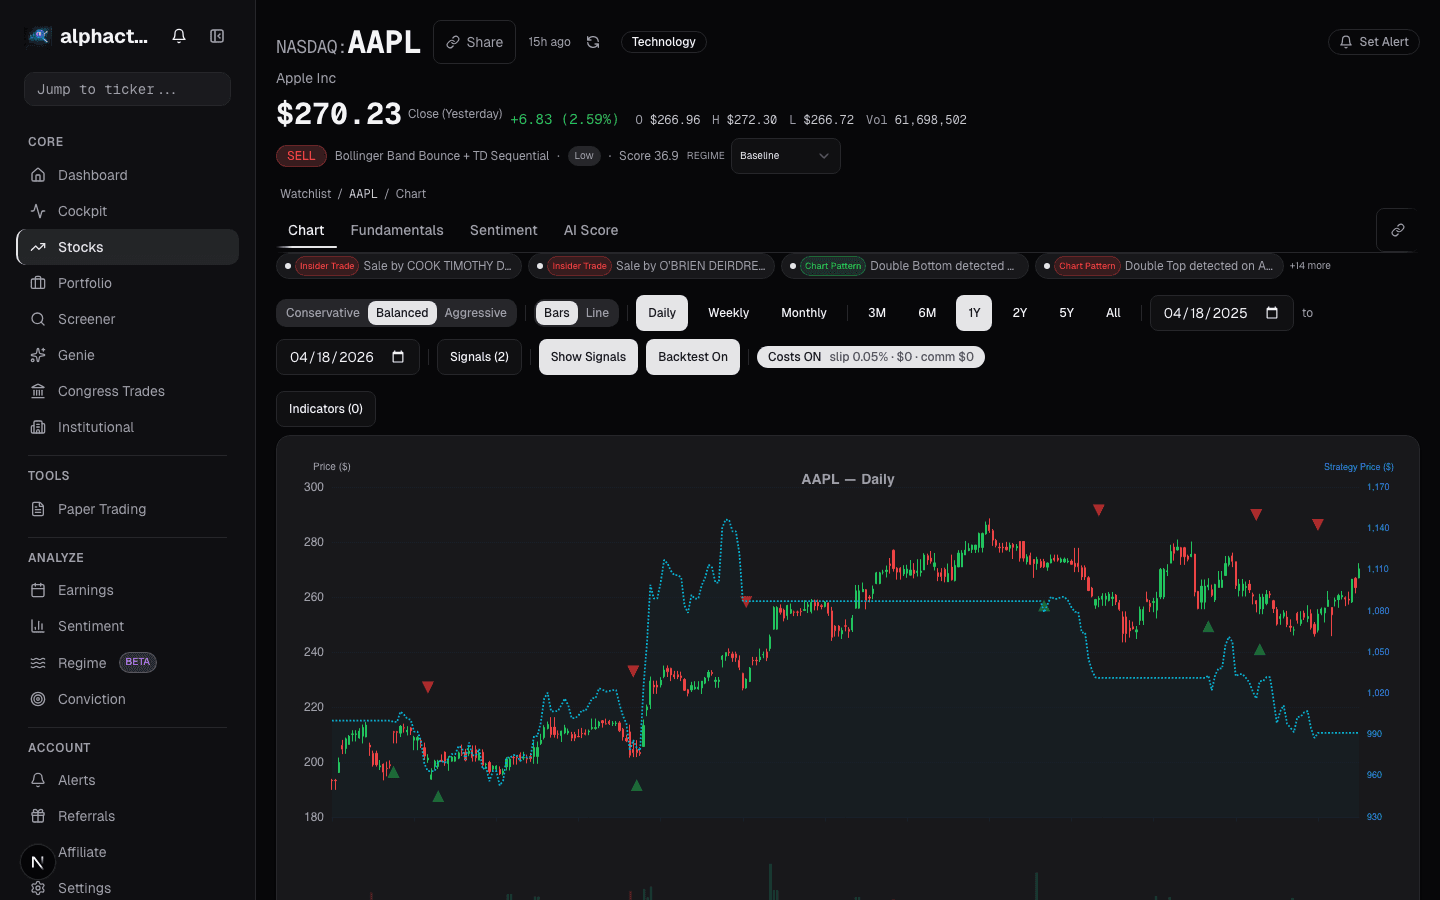
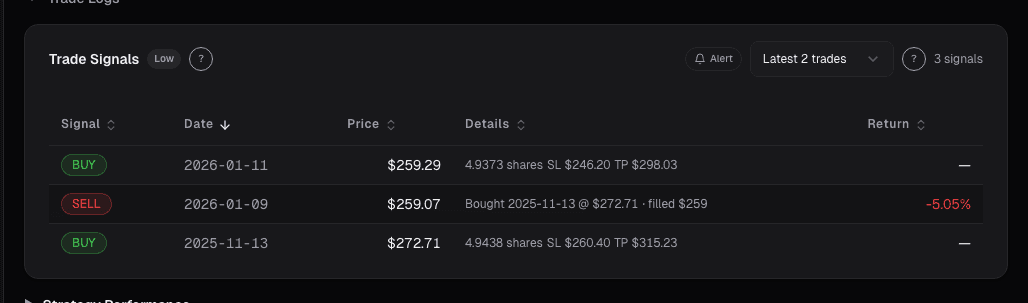
See it in the app
Live dashboard views that match this post. Each tile deep-links to the exact card.


Stocks mentioned
Related reading
Why Stacking 5 Indicators on Your Chart Is Making You Worse
Most traders use too many indicators that say the same thing. Learn how to pick 2-3 complementary indicators and reduce signal noise.
Fibonacci Retracements
An honest look at Fibonacci retracements in trading, why they seem to work, when they actually help, and the 61.8% level's mixed track record.
Ichimoku Cloud: Complicated, but Here's What Matters
A practical breakdown of Ichimoku Cloud trading: which of the five lines actually matter and when simpler indicators do the job just as well.
MACD Beyond Crossovers
The MACD histogram reveals momentum shifts before the signal line cross. Here is how to read it properly and combine it with volume.
Stochastic Oscillator: When It Works and When to Ignore It
The stochastic oscillator thrives in ranging markets and fails in trends. Here is how to use ADX to know which regime you are in and when to trust the signal.
Ready to try alphactor.ai?
Validate your trading strategies with statistical credibility testing. Start free.
Get Started Free