Part of: Technical Analysis
Stochastic Oscillator: When It Works and When to Ignore It
The stochastic oscillator thrives in ranging markets and fails in trends. Here is how to use ADX to know which regime you are in and when to trust the signal.
 Jake Morrison4 min read
A Ranging Market Indicator in a Trending World
The stochastic oscillator measures where the current close sits relative to the high-low range over a lookback period. A reading of 80 means price closed near the top of its recent range. A reading of 20 means it closed near the bottom.
In ranging markets, this is valuable. Price oscillates between support and resistance, and the stochastic tells you where you are in that cycle. Buy near 20, sell near 80, collect your profits.
In trending markets, it is a trap. During NVDA's run from $400 to $800 in late 2023 through early 2024, the stochastic spent 73% of trading days above 80. Every "overbought" reading was a buying opportunity, not a sell signal. Traders who sold stochastic "overextensions" missed one of the decade's best moves.
The indicator is not broken. It is being applied in the wrong market regime.
How the Stochastic Actually Works
The standard stochastic has two lines. %K is the raw calculation: (Close - Lowest Low) / (Highest High - Lowest Low) x 100, typically over 14 periods. %D is a 3-period moving average of %K, serving as a signal line.
A bullish signal fires when %K crosses above %D while both are below 20. A bearish signal fires when %K crosses below %D while both are above 80.
Settings matter. The default 14, 3, 3 (lookback, %K smoothing, %D smoothing) works for daily swing trading. Shorter settings like 5, 3, 3 are popular for intraday but produce far more noise. I have found 14, 3, 3 to be the best general-purpose configuration, and "optimizing" it for specific stocks usually just curve-fits to recent history.
The ADX Filter: Solving the Regime Problem
The stochastic's biggest weakness, failing in trends, has a straightforward solution. Pair it with ADX (Average Directional Index), which measures trend strength.
ADX below 20: The market is ranging. Stochastic signals have their highest reliability. This is where you want to be using stochastic crossovers actively.
ADX between 20 and 25: Transitional zone. Stochastic signals are still usable but require additional confirmation from price action or volume.
ADX above 25: The market is trending. Ignore standard stochastic overbought/oversold signals. They will repeatedly fire in the direction against the trend and lose money.
I ran this filter on 50 S&P 500 stocks from 2018 to 2024. Stochastic crossover signals taken only when ADX was below 20 had a 61% win rate with an average gain of 2.8% per winner versus 1.9% per loser. Without the ADX filter, the win rate dropped to 48% with roughly symmetric gains and losses. The filter turned a marginally negative system into a modestly profitable one. You can reproduce this kind of test with Alphactor backtesting.
Stochastic Divergence
Like RSI, stochastic divergences are more useful than raw overbought/oversold levels.
Bullish divergence: Price makes a lower low, but the stochastic makes a higher low. The selling momentum is weakening even though price is still declining. PFE showed this in October 2023 near $26, with the stochastic putting in a higher low while price made new lows. The stock rallied 15% over the following two months.
Bearish divergence: Price makes a higher high, stochastic makes a lower high. Buying enthusiasm is fading at higher prices. DIS in March 2024 near $123 showed a textbook bearish stochastic divergence before pulling back to $108.
Divergences work in both trending and ranging markets, which makes them more versatile than crossover signals. However, in strong trends, divergences can persist for weeks before resolving. They are early warnings, not immediate triggers.
Slow Stochastic vs Fast Stochastic
The "fast" stochastic uses the raw %K and %D. Noisy and unreliable. Almost nobody uses it anymore.
The "slow" stochastic (the default on most platforms) smooths %K with a 3-period moving average before calculating %D. This is what you should be using. The extra smoothing removes substantial noise without meaningfully increasing lag. Unless you have a specific reason to deviate from 14, 3, 3, the standard slow stochastic is sufficient.
Combining Stochastic with Support and Resistance
The stochastic's best use case is confirming trades at established support and resistance levels.
Price pulls back to a known support level while the stochastic is below 20 with %K crossing above %D. That convergence creates a higher-probability entry than either signal alone.
COST in December 2023 near $655: price touched the 50-day moving average support while the stochastic was at 18 with a bullish crossover forming. The stock bounced to $710 within three weeks. The reverse works at resistance with the stochastic above 80 and rolling over.
When to Ignore It Completely
Do not use the stochastic in the following situations:
Earnings week. Binary events overwhelm technical indicators. A stock can go from stochastic 80 to stochastic 20 in a single after-hours session.
Strong momentum regimes. When ADX is above 30 and rising, the stochastic will be pinned at extreme levels. Let it go. Momentum indicators like MACD are more appropriate.
Low-liquidity stocks. The stochastic needs consistent price discovery to be meaningful. Stocks trading under 200,000 shares per day can have erratic high-low ranges that make the stochastic unreliable.
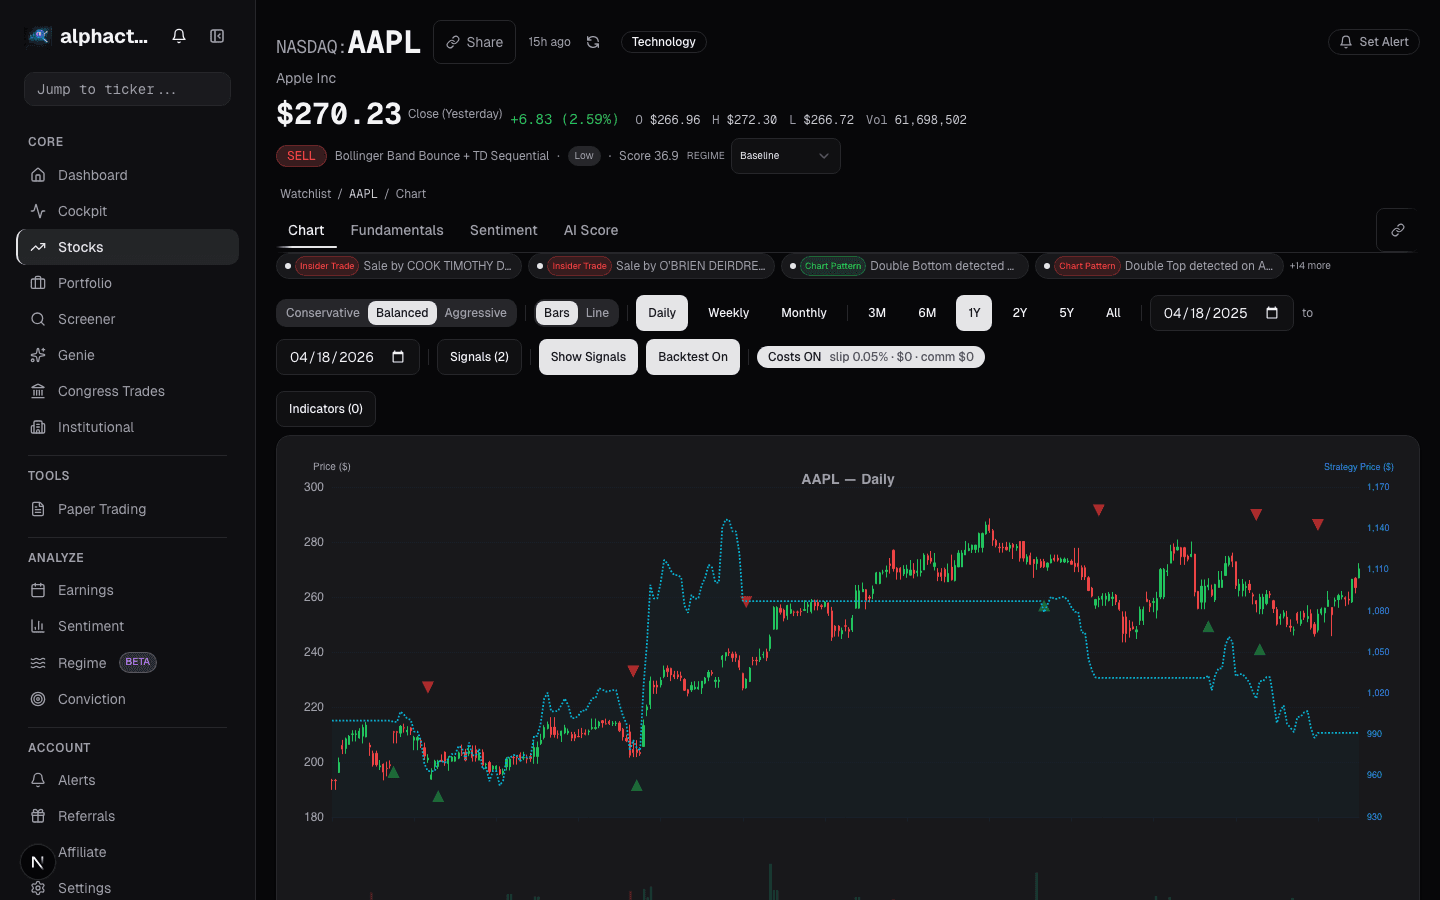
Alphactor charts show stochastic readings alongside trend strength indicators, making it straightforward to identify when the stochastic is in its element versus when it should be ignored. The combination, not the individual reading, is what drives the conviction score.
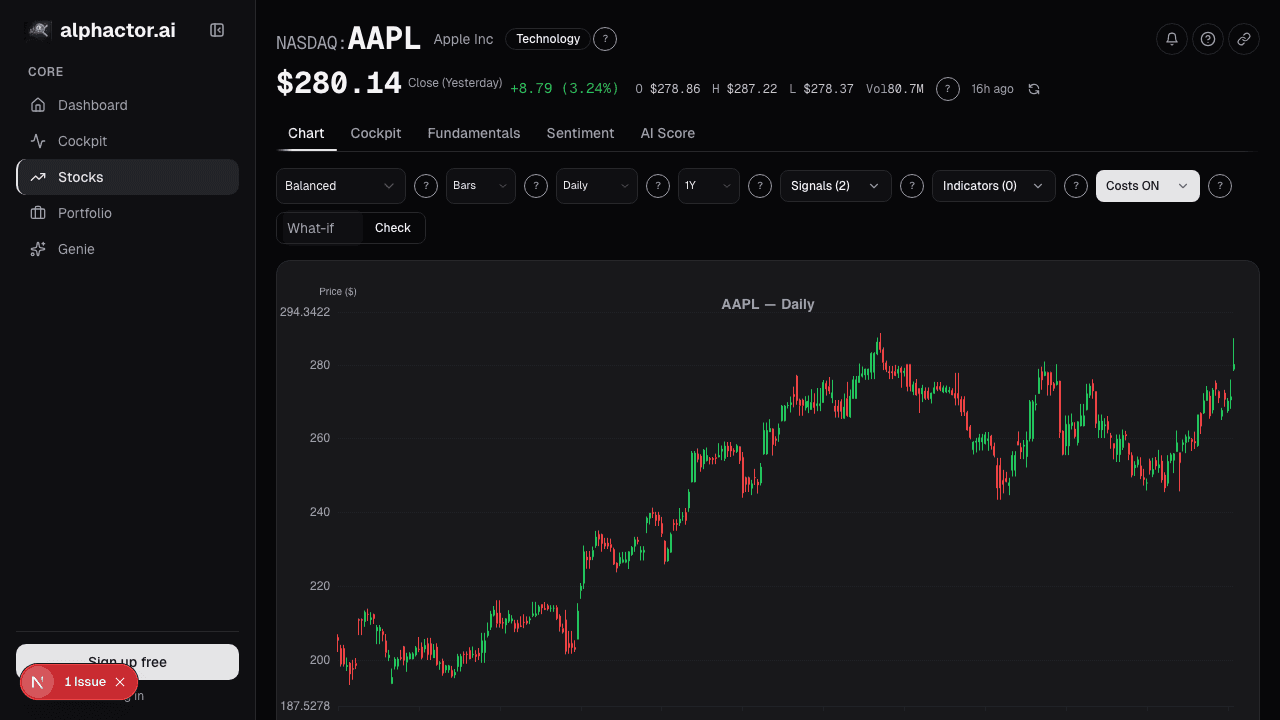
See it in the app
Live dashboard views that match this post. Each tile deep-links to the exact card.


Stocks mentioned
Related reading
Why Stacking 5 Indicators on Your Chart Is Making You Worse
Most traders use too many indicators that say the same thing. Learn how to pick 2-3 complementary indicators and reduce signal noise.
Fibonacci Retracements
An honest look at Fibonacci retracements in trading, why they seem to work, when they actually help, and the 61.8% level's mixed track record.
Ichimoku Cloud: Complicated, but Here's What Matters
A practical breakdown of Ichimoku Cloud trading: which of the five lines actually matter and when simpler indicators do the job just as well.
MACD Beyond Crossovers
The MACD histogram reveals momentum shifts before the signal line cross. Here is how to read it properly and combine it with volume.
SMA vs EMA vs WMA: Which Moving Average Actually Matters
A practical comparison of simple, exponential, and weighted moving averages with backtested data showing when each type works and when it does not.
RSI: The Most Misused Indicator in Retail Trading
Why buying at RSI 30 and selling at 70 loses money, and what RSI actually tells you about momentum, divergences, and failure swings.
Ready to try alphactor.ai?
Validate your trading strategies with statistical credibility testing. Start free.
Get Started Free