Part of: Technical Analysis
SMA vs EMA vs WMA: Which Moving Average Actually Matters
A practical comparison of simple, exponential, and weighted moving averages with backtested data showing when each type works and when it does not.
 Jake Morrison4 min read
They Are All Lagging. Now What?
Every moving average lags. That is the entire point. You smooth out noise to see the underlying direction. The real debate is how much lag you accept in exchange for how much noise reduction.
The honest answer from extensive backtesting: the differences between types are smaller than most people think, and the choice of period matters more than the choice of type. But there are situations where the distinction is real.
Quick Definitions
SMA (Simple Moving Average) gives equal weight to every price in the period. A 50-day SMA treats the price from 50 days ago exactly the same as yesterday's close.
EMA (Exponential Moving Average) weights recent prices more heavily using an exponential decay. A 50-day EMA gives yesterday's price roughly 3.9% weight versus 2% for each day in an SMA.
WMA (Weighted Moving Average) assigns linearly decreasing weights. In a 50-day WMA, yesterday gets weight 50, the day before gets 49, and so on down to 1.
The practical effect: EMA and WMA react faster to recent price changes. SMA is smoother and slower.
Backtested Results: Crossover Systems
I tested a simple system on SPY from 2005 to 2024: go long when the 50-day average crosses above the 200-day, go flat when it crosses below. No leverage, no shorts, reinvested dividends.
50/200 SMA cross: Annualized return 8.7%, max drawdown 19.4%, 11 signals over the period.
50/200 EMA cross: Annualized return 9.1%, max drawdown 17.8%, 16 signals over the period.
50/200 WMA cross: Annualized return 8.9%, max drawdown 18.1%, 14 signals over the period.
The EMA system edged ahead on returns and drawdown, but it generated 45% more signals. More signals means more whipsaws and more transaction costs. After realistic transaction costs and slippage, the three systems were within 0.5% of each other annually.
The period choice, 50/200 versus 20/100 or 10/50, had a much larger impact on performance than the type of average.
When EMA Speed Actually Helps
EMA outperforms in sharp, fast-moving markets where the difference between reacting in one day versus three days matters.
During COVID, the 50-day EMA crossed below the 200-day on SPY on March 4, 2020, at $310. The SMA cross did not fire until March 23 at $222, literally the bottom. The EMA got you out earlier and avoided the worst of the decline.
For individual stocks with higher volatility, EMA's faster response is more valuable. TSLA's 20-day EMA captured the November 2024 rally about two days faster than the SMA. On a stock that moves 5-8% per week, two days can be significant.
When EMA Speed Hurts
In choppy, range-bound markets, EMA's sensitivity becomes a liability. It whipsaws more frequently because it reacts to noise that the SMA would smooth over.
From June to October 2023, SPY traded in a range between $430 and $455. The 20-day EMA produced seven crossover signals with the 50-day EMA. The SMA produced four. The extra three EMA signals were all losers that added up to about 3% in unnecessary round-trip costs.
If you are trading a stock that tends to chop around, like KO or PG in typical market conditions, SMA gives you fewer false signals and more patience.
The 200-Day SMA: Overrated as a Signal, Useful as Context
The 200-day SMA gets treated like a magic line. "The stock is above its 200-day, so the trend is up." Financial media repeats this constantly.
The reality: by the time a stock breaks below its 200-day SMA, it has typically already declined 12-18% from its high. Not timely.
Where it does have value is as a regime filter. When SPY is above its 200-day SMA, subsequent 6-month returns average 7.2% annualized. When below, they average 1.8%. Use it as context, not as a trigger.
WMA: The Forgotten Middle Child
WMA sits between SMA and EMA in responsiveness. In practice, WMA and EMA produce very similar results, with differences measured in fractions of a percent annually. If you are already using EMA, there is no compelling reason to switch.
Practical Recommendations
For trend following on daily charts: Use SMA. The reduced noise outweighs the slower response for most swing and position traders. The 50-day and 200-day SMA remain the most widely watched levels, which creates self-reinforcing support and resistance.
For shorter-term trading (5-20 day holds): EMA is the better choice. The faster reaction time matters when your holding period is measured in days rather than weeks.
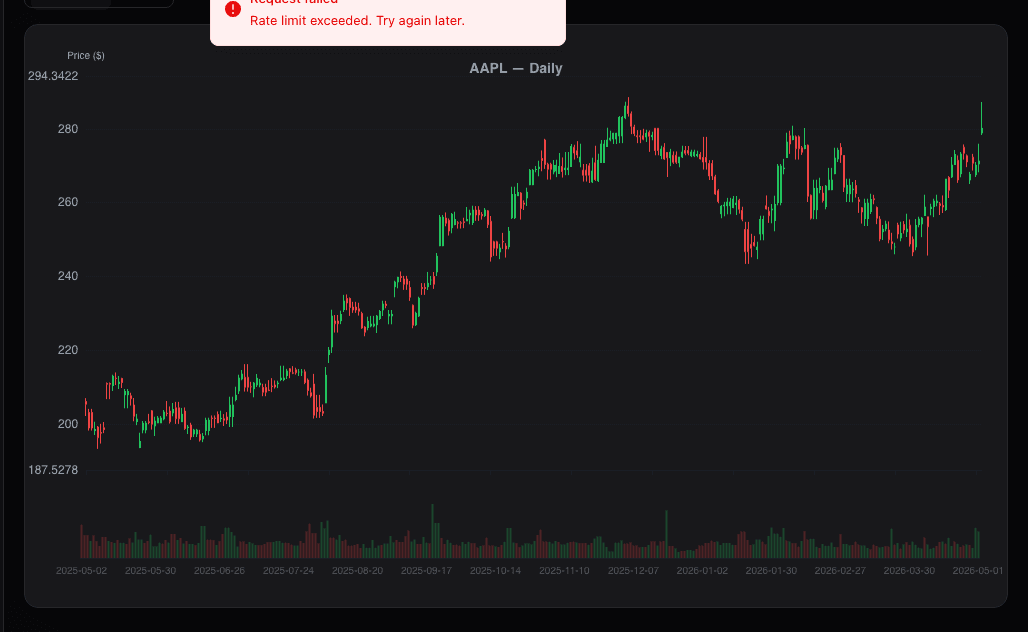
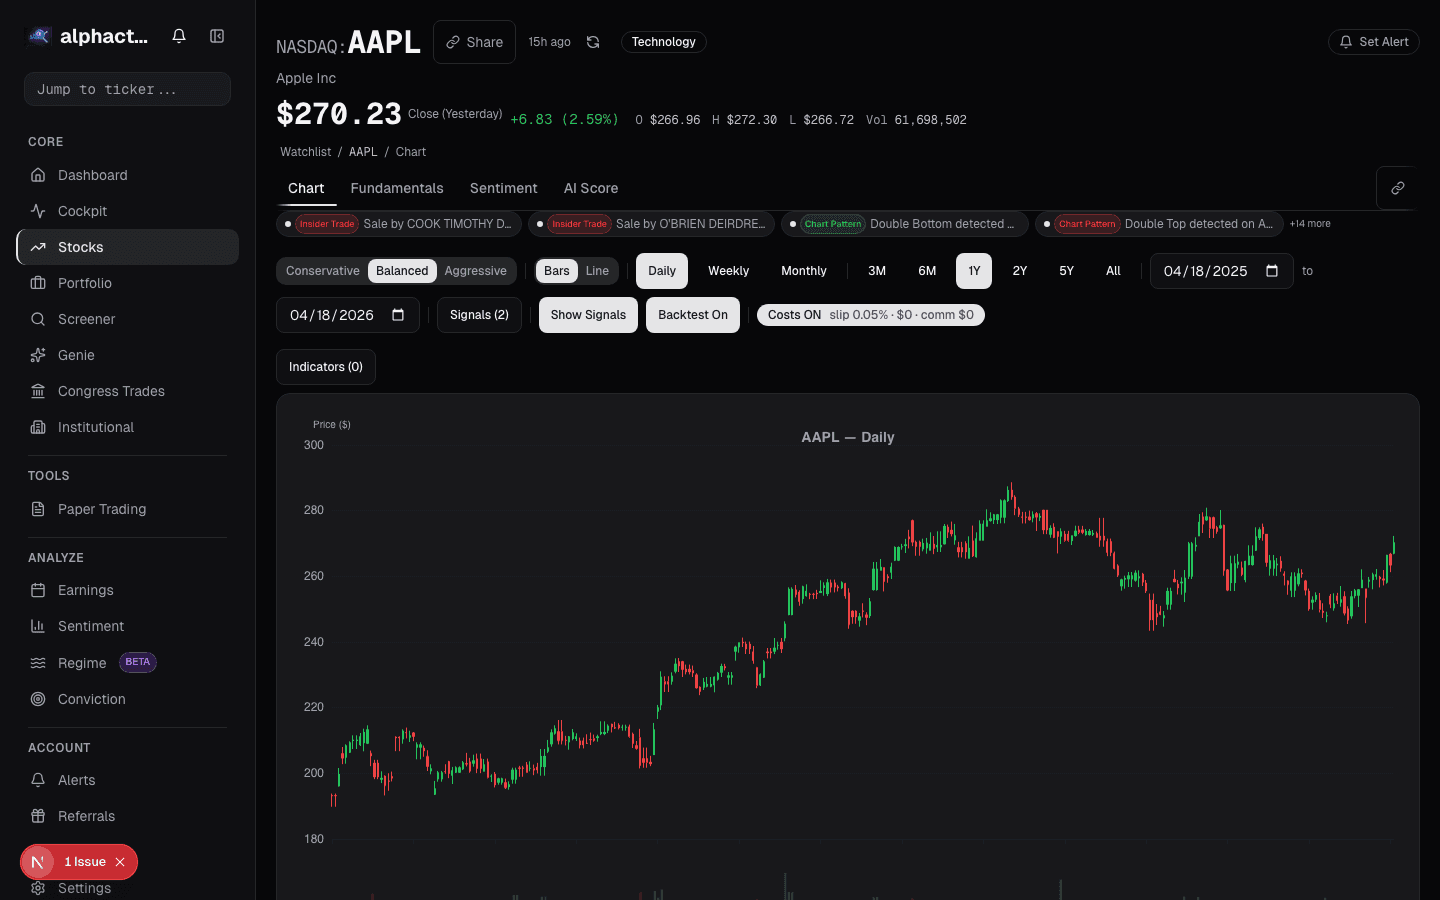
For regime identification: SMA on weekly charts. A 10-week SMA on a weekly chart is functionally similar to a 50-day SMA but smoother and easier to read. Alphactor charts overlay moving averages on price data so you can visually assess regime on any timeframe.
Alphactor backtesting lets you test different moving average types and periods against your specific watchlist. The results will depend heavily on the stocks you trade. What works on high-beta growth stocks may underperform on low-volatility dividend payers.
What Actually Matters
Stop debating SMA vs EMA. The moving average type contributes maybe 5% to the overall performance of a trend-following system. The other 95% comes from the period length, the exit rules, position sizing, and whether you have the discipline to follow the system when it is underwater.
Pick one type. Test different periods. Focus on the rules around it, not the calculation behind it.
See it in the app
Live dashboard views that match this post. Each tile deep-links to the exact card.


Stocks mentioned
Related reading
Why Stacking 5 Indicators on Your Chart Is Making You Worse
Most traders use too many indicators that say the same thing. Learn how to pick 2-3 complementary indicators and reduce signal noise.
Fibonacci Retracements
An honest look at Fibonacci retracements in trading, why they seem to work, when they actually help, and the 61.8% level's mixed track record.
Ichimoku Cloud: Complicated, but Here's What Matters
A practical breakdown of Ichimoku Cloud trading: which of the five lines actually matter and when simpler indicators do the job just as well.
MACD Beyond Crossovers
The MACD histogram reveals momentum shifts before the signal line cross. Here is how to read it properly and combine it with volume.
Stochastic Oscillator: When It Works and When to Ignore It
The stochastic oscillator thrives in ranging markets and fails in trends. Here is how to use ADX to know which regime you are in and when to trust the signal.
Ready to try alphactor.ai?
Validate your trading strategies with statistical credibility testing. Start free.
Get Started Free