Part of: Technical Analysis
Support and Resistance
A practical guide to drawing support and resistance zones instead of precise lines, using volume to confirm levels and understanding what makes a level…
 Jake Morrison5 min read
Lines vs. Zones: The First Mistake
Every beginner draws support and resistance as precise horizontal lines. I did too. I would zoom into a chart, find the exact price where a candle wick touched, and draw a line to the penny. Then I would get stopped out when price blew through my "level" by $0.50 before reversing exactly as expected.
Support and resistance are zones, not lines. A level where AAPL reversed at $172.34 last month does not mean it will reverse at $172.34 again. It means the $170-$174 area has buyers. The sooner you start thinking in zones of $2-5 on most stocks (wider for higher-priced or more volatile names), the sooner your levels start working.
I draw my zones using the bodies of candles at turning points, not the wicks. Wicks represent momentary extremes. Bodies represent where traders were willing to close positions. A cluster of candle bodies reversing in the $170-$174 range on AAPL tells me more than a single wick that touched $169.80 on a random Tuesday.
Volume Changes Everything
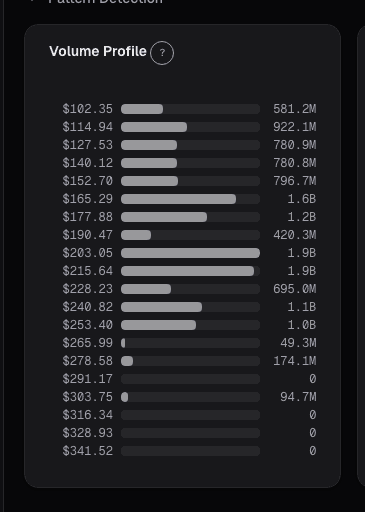
The difference between a good S/R level and a great one is volume. Specifically, you want to see what the Volume Profile tells you about where trading activity concentrates.
High Volume Nodes (HVNs) are price areas where a lot of trading occurred. These act as magnets, price tends to spend time at these levels because both buyers and sellers are comfortable transacting there. When price revisits an HVN, it often consolidates or reverses because there is a wall of historical positions creating supply and demand.
Low Volume Nodes (LVNs) are price areas with little trading activity. Price tends to move through these quickly. If there is an LVN between two HVNs, expect price to "jump" through that gap.
Example: MSFT traded heavily between $370-$380 in late 2024 before breaking out to $420. On any pullback, that $370-$380 HVN is significant support because thousands of traders built positions there and will likely defend them. A thin line at "$378" misses the point entirely.
If you do not use Volume Profile, at minimum check whether your S/R level had above-average volume bars on the candles that formed the reversal. If a stock bounced off $50 on 2x average volume, that is a real level. If it bounced on light volume during a holiday week, I would not lean on it.
Not All Levels Are Equal
The strength of a support or resistance level depends on several factors, and most traders do not weight them properly.
Number of touches. A level tested five times is stronger than one tested once. Each test that holds confirms that buyers (support) or sellers (resistance) are genuinely present at that price. But here is the nuance most people miss: each test also weakens the level slightly. Every time support holds, some of those buy orders get filled and are not coming back. A level tested eight times in two weeks is not super strong, it is about to break.
Recency. A support level from last month is more relevant than one from two years ago. Market participants change. The fund that was buying heavily at $90 two years ago may have already sold. I weight levels from the last 3-6 months most heavily for swing trading.
Timeframe. A weekly level that has held for a year trumps a daily level that formed last week. When a support zone is visible on the weekly chart, institutional traders see it too. Daily and intraday levels are more fragile.
How price arrived. A level reached by a sharp decline is more likely to produce a V-shaped bounce than a level reached by a slow grind down. Sharp declines often overshoot and snap back. Slow grinds that test support tend to eventually break it.
The Flip: When Support Becomes Resistance
One of the most reliable phenomena in technical analysis is polarity, when broken support becomes resistance and vice versa. It works because traders who bought at support and watched it break are now underwater. Many of them will sell at breakeven if price comes back to that level, creating selling pressure exactly where buying pressure used to be.
I caught one of my best trades on this principle with AMD in 2023. The stock had strong support around $94-$97 that it broke decisively on a rough earnings reaction. When it bounced back to that zone a few weeks later, it rejected hard. Former support acted as a ceiling. The short setup was almost mechanical.
Alphactor's signal system picks up on these polarity shifts because they show up as failed support retests with declining momentum on Alphactor charts. When I see that pattern flagged alongside a weakening conviction score, it is usually a level I want to watch for a short entry or at least avoid going long.
Practical Framework
Here is how I identify and rank S/R zones:
- Start on the weekly chart. Mark zones where price has reversed at least twice in the past year. Use bodies, not wicks.
- Drop to the daily chart. Refine the zones and add levels from the last 3-6 months.
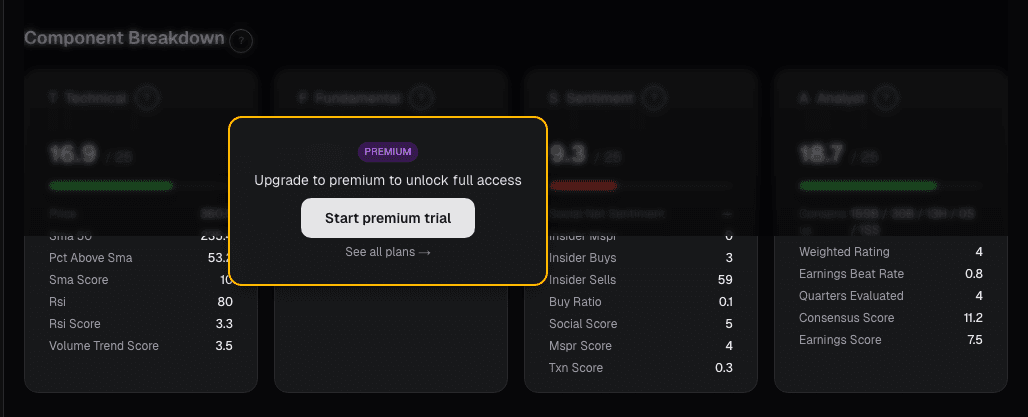
- Check volume. Overlay Volume Profile or check volume bars at each level. Prioritize high-volume zones. The fundamentals view provides historical volume data to help confirm whether a level saw meaningful participation.
- Note fresh vs. tested levels. A level being tested for the first time on a pullback is more likely to hold than one being tested for the sixth time.
- Watch for polarity. Recently broken support levels are prime resistance candidates, and recently broken resistance levels are prime support.
The goal is not to draw every possible level. Too many lines is just as bad as wrong lines. I typically mark 3-5 significant zones on any chart I am actively trading. Those are the levels that matter, and I plan my entries, exits, and stops around them.
Do not let precision be the enemy of usefulness. A well-placed zone with volume confirmation will serve you far better than a laser-precise line drawn to the penny.
See it in the app
Live dashboard views that match this post. Each tile deep-links to the exact card.


Stocks mentioned
Related reading
5 Candlestick Patterns With Real Statistical Edge
Most candlestick patterns are noise. Research shows only a handful have measurable predictive power, and context matters more than the pattern itself.
Why Stacking 5 Indicators on Your Chart Is Making You Worse
Most traders use too many indicators that say the same thing. Learn how to pick 2-3 complementary indicators and reduce signal noise.
How Earnings Season Actually Moves Markets
Why the market's reaction to earnings reports depends on guidance, positioning, and expectations far more than the headline EPS number.
Fibonacci Retracements
An honest look at Fibonacci retracements in trading, why they seem to work, when they actually help, and the 61.8% level's mixed track record.
Ichimoku Cloud: Complicated, but Here's What Matters
A practical breakdown of Ichimoku Cloud trading: which of the five lines actually matter and when simpler indicators do the job just as well.
Ready to try alphactor.ai?
Validate your trading strategies with statistical credibility testing. Start free.
Get Started Free