Part of: Technical Analysis
On-Balance Volume: The Simplest Way to Spot Accumulation
OBV tracks whether volume flows into or out of a stock. When OBV diverges from price, someone knows something you do not.
 Jake Morrison4 min read
Volume Leads Price
Joe Granville introduced On-Balance Volume in 1963 with a simple premise: volume precedes price. Smart money moves before price does. If volume is flowing into a stock while price is flat or declining, accumulation is happening. If volume is flowing out while price holds steady, distribution is underway.
Sixty years later, OBV remains one of the most useful indicators in any trader's toolkit. Not because it is sophisticated. Because it is not.
How OBV Works
The calculation is almost embarrassingly simple. If today's close is higher than yesterday's, add today's volume to the running total. If today's close is lower, subtract it. If the close is unchanged, OBV stays flat.
That is it. No lookback period. No smoothing. No parameters to optimize. The absolute value of OBV is meaningless. What matters is the direction and the relationship between OBV's trend and price's trend.
OBV rising means more volume is occurring on up days than down days. Net buying pressure. OBV falling means more volume on down days. Net selling pressure. When OBV's direction matches price, the trend is healthy. When they diverge, pay attention.
OBV Divergence: The Money Signal
The highest-value signal OBV produces is divergence from price.
Bullish OBV divergence: Price is flat or making lower lows, but OBV is rising or making higher lows. Someone is accumulating shares without pushing price higher, typically institutional buyers using algorithms to buy gradually without moving the market.
META in October-November 2022 is the canonical recent example. Price bottomed around $88-90 and spent three weeks going sideways. Standard chart analysis showed a stock going nowhere. But OBV was trending steadily upward throughout that period, volume on up days consistently exceeding volume on down days. The stock rallied 300%+ over the following 18 months. OBV saw the accumulation three weeks before price confirmed it. The 13F explorer confirmed later that several major funds had been building positions during exactly this window.
Bearish OBV divergence: Price is rising or making higher highs, but OBV is flat or declining. The rally is happening on shrinking volume. Buyers are less enthusiastic at higher prices. Someone may be selling into the strength.
ARKK in early 2021 showed persistent bearish OBV divergence from February onward. Price kept pushing higher through April, but OBV had peaked in February. The volume conviction behind the rally was evaporating. ARKK eventually declined 75% from its peak.
Institutional Accumulation Patterns
Institutions cannot buy or sell large positions quickly without impacting the market. A fund looking to accumulate 2 million shares of a mid-cap stock might take two to four weeks to build the position, buying on dips and going quiet on rallies.
This creates a specific OBV pattern: steady upward drift in OBV while price chops sideways in a tight range. The fund is absorbing every dip seller's shares without chasing price higher. Once they have their position, they stop buying, and the stock often breaks out on the next catalyst because the available supply of shares at those prices has been removed.
The reverse, distribution, looks like OBV steadily declining while price holds near highs. GOOGL in September 2023 showed this pattern. Price was near $138-140, just below its yearly high. OBV spent three weeks trending down while price held firm. The stock then dropped 8% over the following two weeks.
Confirming Breakouts with OBV
Not all breakouts are equal, and OBV helps you distinguish real ones from fake ones.
Confirmed breakout: Price breaks above resistance and OBV simultaneously reaches a new high. This means volume is supporting the move. Fresh buying is entering at higher prices. The breakout has conviction.
Unconfirmed breakout: Price breaks above resistance but OBV does not make a new high. The breakout is happening on diminishing volume. Fewer participants are willing to buy at these prices. The odds of a false breakout are materially higher.
During the semiconductor rally in late 2023, AVGO broke above $1,000 in November with OBV simultaneously hitting a new all-time high. Confirmed. The stock reached $1,400 within two months. By contrast, INTC broke above $45 in late December 2023 with OBV well below its prior peaks. That breakout failed within two weeks, and INTC was back at $42.
OBV Limitations
OBV has blind spots worth knowing about.
It treats all volume equally. A 10-million-share day where the stock closes up $0.01 gets the same OBV credit as a day where it closes up $5.00. Stocks that chop around near unchanged on heavy volume can distort readings.
It does not account for where within the day's range the close falls. A stock that opens at $100, drops to $95, and closes at $100.50 gets full bullish OBV credit even though most of the day's volume occurred during the decline.
OBV also cannot distinguish between types of volume. Options hedging, index rebalancing, and ETF creation/redemption all generate volume that has nothing to do with directional conviction.
Despite these limitations, OBV divergence remains one of the most reliable early warning signals available. In Alphactor charts, OBV trend analysis appears alongside other volume and momentum indicators, giving you the full picture of whether volume is confirming or contradicting the price action.
The Simplest Edge
OBV works because it captures something fundamental: the flow of money. When volume persistently moves in one direction while price moves in another, the volume is usually right. The simplicity is a feature, not a bug.
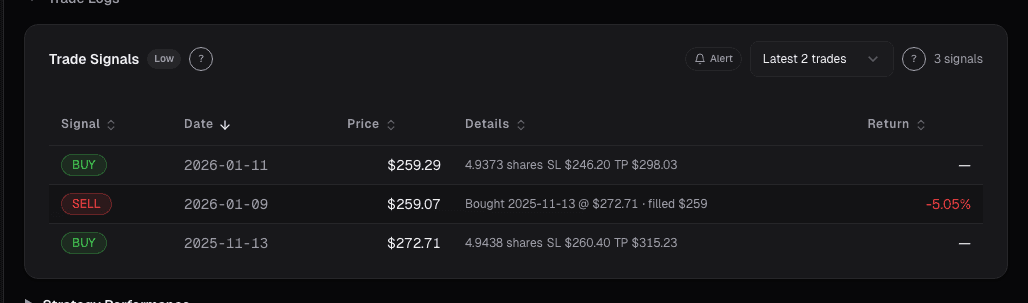
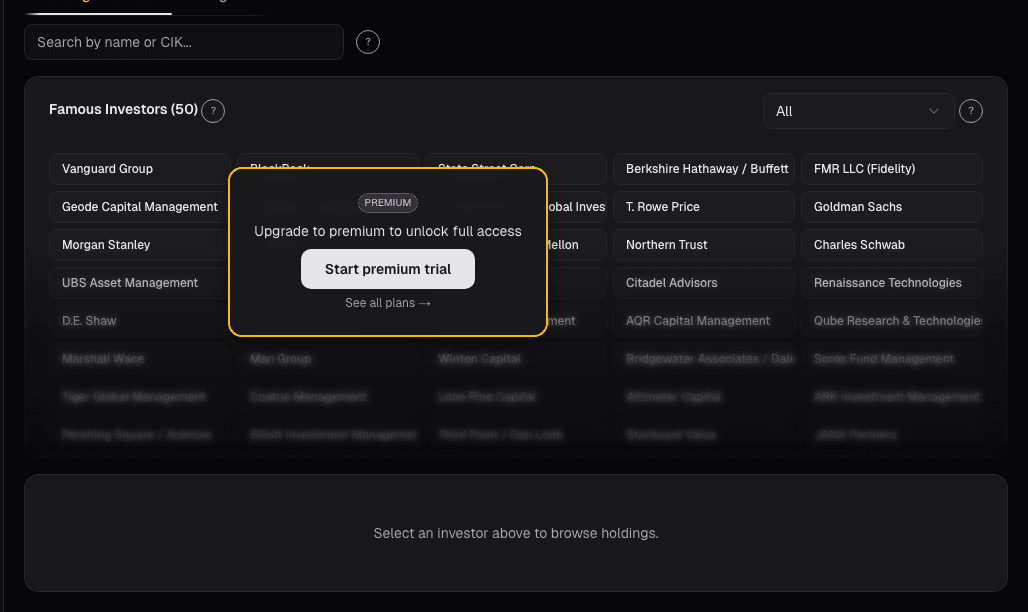
See it in the app
Live dashboard views that match this post. Each tile deep-links to the exact card.


Stocks mentioned
Related reading
Why Stacking 5 Indicators on Your Chart Is Making You Worse
Most traders use too many indicators that say the same thing. Learn how to pick 2-3 complementary indicators and reduce signal noise.
Dark Pool Prints
Off-exchange share above 45% clustered into weakness signals institutional accumulation. Dark pool prints are regulated, post-trade transparent, and measurable.
Dashboard Movers: Catching Unusual Moves Before They're Old
Most platform movers lists are dangerous, they rank by % change alone, surfacing illiquid small-caps on meaningless volume.
Market Breadth: The Health Check Most Investors Skip
How advance-decline lines, new highs-lows, and participation rates reveal whether a rally is built on solid ground or propped up by a handful of stocks.
Volume Profile: Where Real Support and Resistance Lives
Price-based support and resistance is a guess. Volume profile shows you where actual transactions occurred and where institutions have real positions to defend.
Ready to try alphactor.ai?
Validate your trading strategies with statistical credibility testing. Start free.
Get Started Free