Pairs Trading for Retail Investors: Simpler Than You Think
A practical guide to pairs trading using cointegration, with a worked example on XOM/CVX and backtest results showing how market-neutral strategies reduce…
 Marcus Chen4 min read
What Pairs Trading Actually Is
Pairs trading is a market-neutral strategy that profits from the relative movement between two correlated securities. You go long one and short the other when their price relationship deviates from the historical norm, then close both positions when the relationship reverts.
The strategy dates back to the 1980s at Morgan Stanley, where Nunzio Tartaglia's quantitative group systematically traded pairs of stocks. The appeal is that you are not betting on market direction. Whether the S&P 500 goes up or down, your P&L depends only on the spread between your two positions.
Correlation Is Not Enough
The most common mistake in pairs trading is selecting pairs based on correlation alone. ExxonMobil (XOM) and Chevron (CVX) have a 10-year correlation of 0.91. But correlation measures whether two series move in the same direction, not whether their spread is mean-reverting.
What you need is cointegration: a statistical relationship where the spread between two price series is stationary, meaning it fluctuates around a stable mean and tends to revert after deviations. Two stocks can be highly correlated but not cointegrated (they trend together but the gap between them can widen permanently). Conversely, two stocks with moderate correlation can be strongly cointegrated.
The Engle-Granger test and the Johansen test are the standard tools for testing cointegration. For XOM/CVX, the Engle-Granger test yields a p-value of 0.003 over the 2014-2024 period, confirming cointegration at the 1% significance level.
A Worked Example: XOM and CVX
Here is the strategy we backtested:
- Pair: XOM (long or short) vs. CVX (opposite side)
- Spread calculation: Log price ratio of XOM/CVX, z-scored using a 60-day rolling mean and standard deviation
- Entry: Open a position when the z-score exceeds +2.0 or falls below -2.0
- Exit: Close when the z-score reverts to 0, or stop out at z-score of +/- 3.5
- Position sizing: Equal dollar amounts on each leg
- Period: January 2014 through December 2024
Over 11 years, the strategy generated 87 round-trip trades:
- Win rate: 71.3%
- Average winner: +2.1% (on the spread)
- Average loser: -2.8%
- Profit factor: 1.89
- Maximum drawdown: -7.3%
- Annualized return: 5.8%
- Sharpe ratio: 1.24
The 5.8% annualized return is modest, but the -7.3% maximum drawdown and 1.24 Sharpe ratio are what make this interesting. The strategy was invested only 34% of the time. On a risk-adjusted and time-adjusted basis, the return per unit of drawdown is attractive, especially as a portfolio diversifier that has near-zero correlation with the broad market.
Why Market Neutrality Matters
During the March 2020 crash, SPY dropped 33.9% peak to trough. The XOM/CVX pairs strategy returned +1.4% over the same period because the spread between the two energy stocks compressed as both sold off at similar rates. In Q4 2018, when SPY fell 19.8%, the pairs strategy returned -0.3%. Essentially flat.
This is the structural advantage of market-neutral strategies. The beta exposure cancels out. Your risk is concentrated in the spread, which is a much narrower and more predictable distribution than directional equity exposure. For investors with existing long equity portfolios, adding a pairs trading allocation reduces portfolio-level drawdowns without requiring you to time the market.
Scaling Beyond One Pair
A single pair is a proof of concept, not a portfolio. The real power of pairs trading comes from running multiple pairs simultaneously. Within the energy sector alone, you can construct pairs from XOM/CVX, SLB/HAL, COP/EOG, and several others. Across sectors, any two stocks in the same industry with a confirmed cointegration relationship are candidates.
When we expanded to 15 cointegrated pairs across energy, financials, and technology (including JPM/BAC, MSFT/GOOG, HD/LOW) -- candidates you can identify using the stock comparison view -- the portfolio-level results improved significantly:
- Annualized return: 8.7%
- Maximum drawdown: -5.1%
- Sharpe ratio: 1.61
- Correlation with SPY: 0.08
The diversification across pairs reduced drawdown and increased returns. Individual pairs go through periods where cointegration breaks down temporarily, but with 15 pairs, the probability that all relationships break simultaneously is low.
Risks and Validation
Cointegration is not permanent. Structural changes to a business (mergers, regulatory shifts, strategy pivots) can permanently alter the relationship between two stocks. GE and HON were a classic industrial pair until GE's financial engineering unraveled the relationship after 2017. You need to re-test cointegration regularly and drop pairs where the statistical evidence deteriorates.
Short selling introduces its own frictions: borrow costs, margin requirements, and the asymmetric risk of short positions. For retail investors, using liquid large-caps keeps borrow costs minimal (typically under 0.5% annualized for names like XOM, JPM, or MSFT).
The practical validation workflow on Alphactor involves four layers: backtest the spread strategy across the full period via Alphactor backtesting, run walk-forward testing to confirm the cointegration relationship held across different time windows, use Monte Carlo simulation to stress-test the trade sequence, and check parameter stability by varying the z-score thresholds and lookback window. A pair that passes all four layers is a candidate for live deployment. A pair that only looks good on the full-period backtest but fails walk-forward testing probably had a regime of strong cointegration that flatters the aggregate statistics. Start free to run this validation workflow on your own pairs.
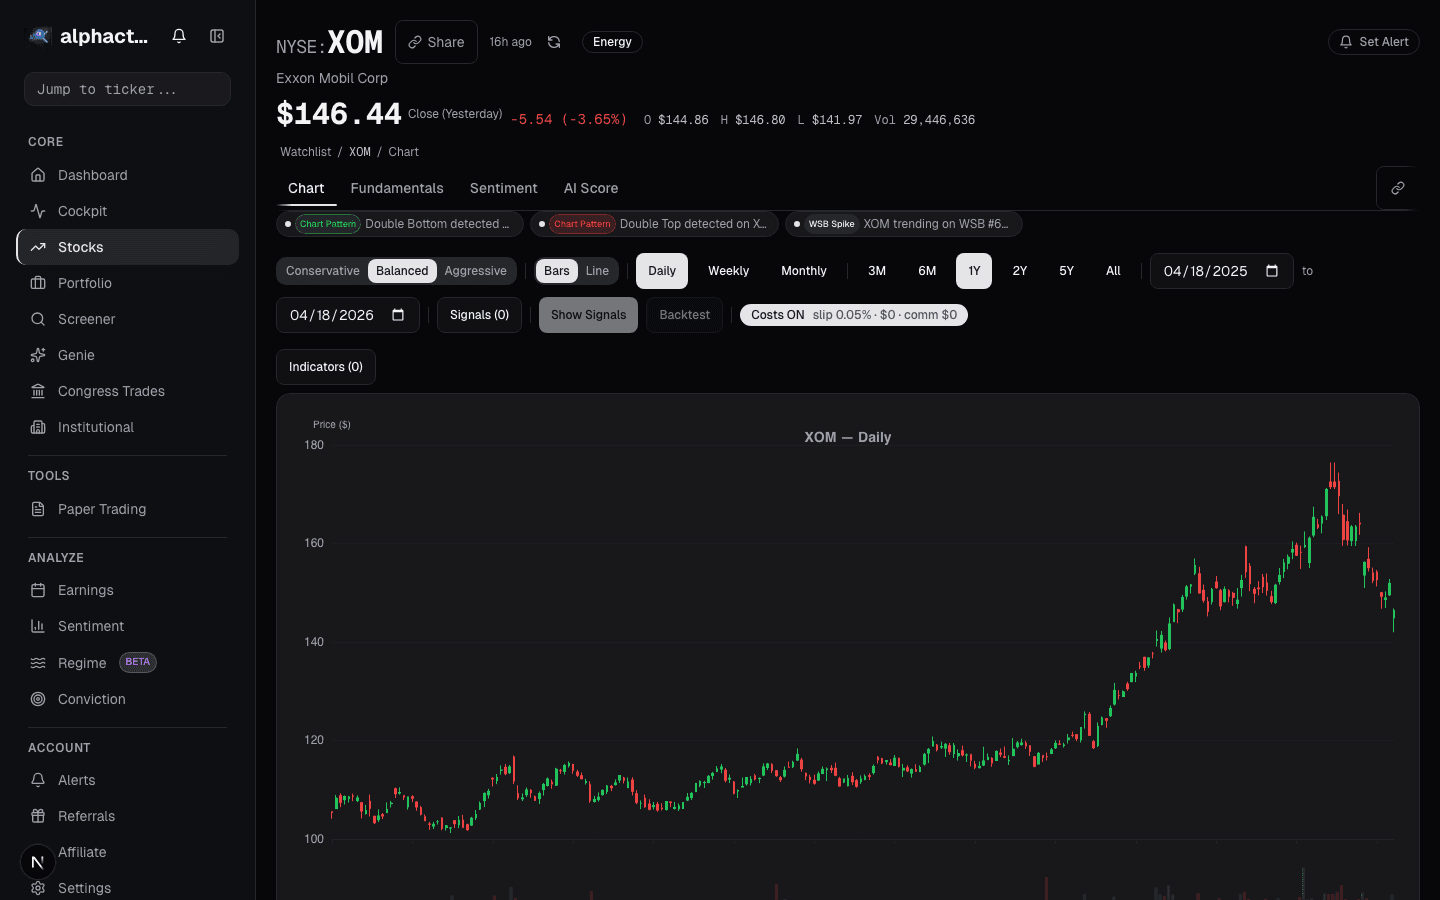
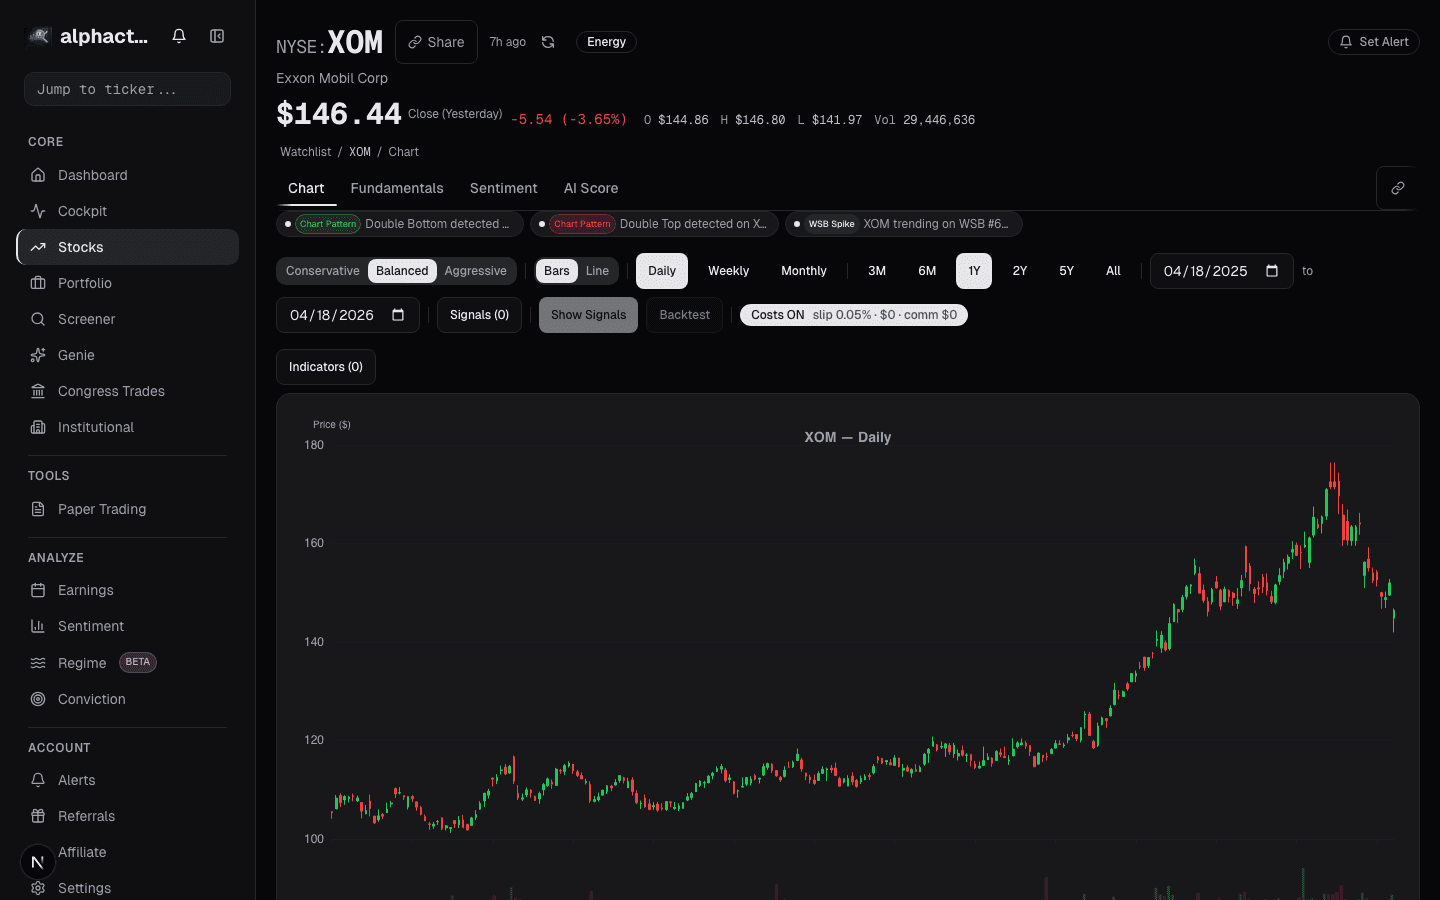
See it in the app
Live dashboard views that match this post. Each tile deep-links to the exact card.

Stocks mentioned
Related reading
Breakout Strategies
A systematic look at breakout trading across 500 stocks over 10 years, with real numbers on win rates, expectancy, and the filters that separate signal from…
Earnings Season Checklist: What to Watch Before, During
A structured approach to earnings season: how to prepare, what metrics matter on the call, and how to interpret post-earnings price action.
Factor Investing in Plain English
Value, momentum, quality, size, and volatility: the five major investment factors explained without jargon, with practical applications for retail portfolios.
Regime-Aware Strategy Selection
Markets cycle through trends, ranges, and shocks. Learn how regime detection drives which strategy runs, and why a mixture of experts beats a single static…
Risk Management for Retail Portfolios
Practical position sizing, stop-loss strategies, correlation awareness, and drawdown limits for retail investors managing their own money.
Ready to try alphactor.ai?
Validate your trading strategies with statistical credibility testing. Start free.
Get Started Free