Breakout Strategies
A systematic look at breakout trading across 500 stocks over 10 years, with real numbers on win rates, expectancy, and the filters that separate signal from…
 Marcus Chen4 min read
The Appeal of Breakouts
Breakout strategies are among the oldest systematic approaches in trading. The logic is intuitive: when a stock clears a resistance level on high volume, demand has overwhelmed supply, and the path of least resistance is higher. Richard Donchian formalized this in the 1950s with channel breakouts. The Turtle Traders used a variant to generate hundreds of millions in the 1980s.
The question is whether the edge survives in modern equity markets where algorithms front-run obvious levels and retail traders crowd into every flagged breakout on social media. To answer that, we need data, not opinions.
The Test Setup
We ran a 20-day Donchian channel breakout strategy on the Russell 1000 universe from January 2014 through December 2024. Rules were simple: buy when price closes above the 20-day high, exit when price closes below the 10-day low. Position sizing was fixed at 2% of equity per trade. No leverage. No shorting. Commissions modeled at $0.005 per share.
Over 10 years, the system generated 14,237 trades across approximately 500 liquid names. Here is what the raw numbers looked like:
- Win rate: 38.2%
- Average winner: +6.8%
- Average loser: -3.1%
- Profit factor: 1.34
- Maximum drawdown: -28.4% (Q4 2018 and March 2020)
- CAGR: 7.9%
That 7.9% CAGR looks underwhelming next to the S&P 500's roughly 12% annual return over the same period. But the raw breakout is just the baseline. The real question is what happens when you add filters.
Volume Confirmation Changes Everything
Adding a volume filter (require breakout day volume to exceed 1.5x the 20-day average volume) cut total trades to 8,412 and shifted the profile noticeably:
- Win rate: 41.7%
- Average winner: +7.4%
- Average loser: -3.0%
- Profit factor: 1.52
- Maximum drawdown: -22.1%
- CAGR: 10.3%
The volume filter eliminates low-conviction breakouts where price drifts above the channel on thin activity. Those tend to reverse. When institutions are driving the move, the follow-through is materially better.
Regime Matters More Than Parameters
We split the 10-year window into regime buckets using a 200-day moving average filter on SPY. When SPY traded above its 200-day average, the breakout strategy returned 14.1% annualized. Below the 200-day average, it returned -4.2%.
This is not surprising. Breakout strategies are inherently long-biased, and buying breakouts in a declining market is fighting the tide. Adding a simple regime filter (only take long breakouts when SPY is above its 200-day MA) produced the strongest variant:
- CAGR: 11.8%
- Maximum drawdown: -16.7%
- Profit factor: 1.71
- Sharpe ratio: 0.89

The drawdown reduction from -28.4% to -16.7% is significant. A 28% drawdown challenges the discipline of most traders. A 17% drawdown is within the range that a systematic process can absorb without behavioral interference.
Walk-Forward Validation
Single-period backtests invite overfitting. We ran walk-forward testing with a 24-month in-sample window and a 6-month out-of-sample window, rolling forward in 6-month steps across the full 10-year period. The walk-forward efficiency ratio (out-of-sample performance divided by in-sample performance) came in at 0.72. Any value above 0.50 suggests the strategy captures a real effect rather than curve-fitted noise.
Alphactor's walk-forward engine automates this process. You define the in-sample and out-of-sample windows, and the platform rolls them forward, computes the efficiency ratio, and flags strategies that degrade out of sample. You can run this on any strategy before committing capital -- it is non-negotiable.
Monte Carlo Stress Testing
We ran 10,000 Monte Carlo simulations by reshuffling the trade sequence. The 5th percentile CAGR (worst 5% of outcomes) was 4.1%, and the 5th percentile maximum drawdown was -31.2%. The median CAGR was 11.4%. This means that even in an unlucky ordering of the same trades, the strategy stayed positive. The drawdown risk in the tail, however, is real. Position sizing and portfolio-level diversification are essential.
What Breakouts Do Not Do
Breakout strategies do not work on every stock or in every regime. They concentrate returns in a small number of large winners, which means long stretches of small losses punctuated by occasional outsized gains. The psychological burden of a 38% win rate is real. Most traders abandon breakout systems during the inevitable losing streaks, which is precisely when the next big winner tends to appear.
They also underperform in range-bound markets. If the S&P 500 chops sideways for 18 months, as it did in 2015-2016, breakout systems will bleed from false signals. This is why regime filtering and position-sizing discipline are structural requirements, not optional add-ons.
The Systematic Takeaway
A basic 20-day breakout on U.S. large caps generates a modest edge. Adding volume confirmation and a regime filter roughly doubles the risk-adjusted return and cuts maximum drawdown by 40%. Walk-forward testing confirms the effect is not curve-fitted. Monte Carlo analysis shows the tail risk is manageable with proper sizing.
The edge in breakouts is not in the breakout itself. It is in the filters, the sizing, and the discipline to execute 14,000 trades over a decade without second-guessing the system. That is where Alphactor backtesting earns its value: it lets you test and validate the full system before a single dollar is at risk. When you are ready to validate without risking capital, paper trading bridges the gap between backtest and live deployment.
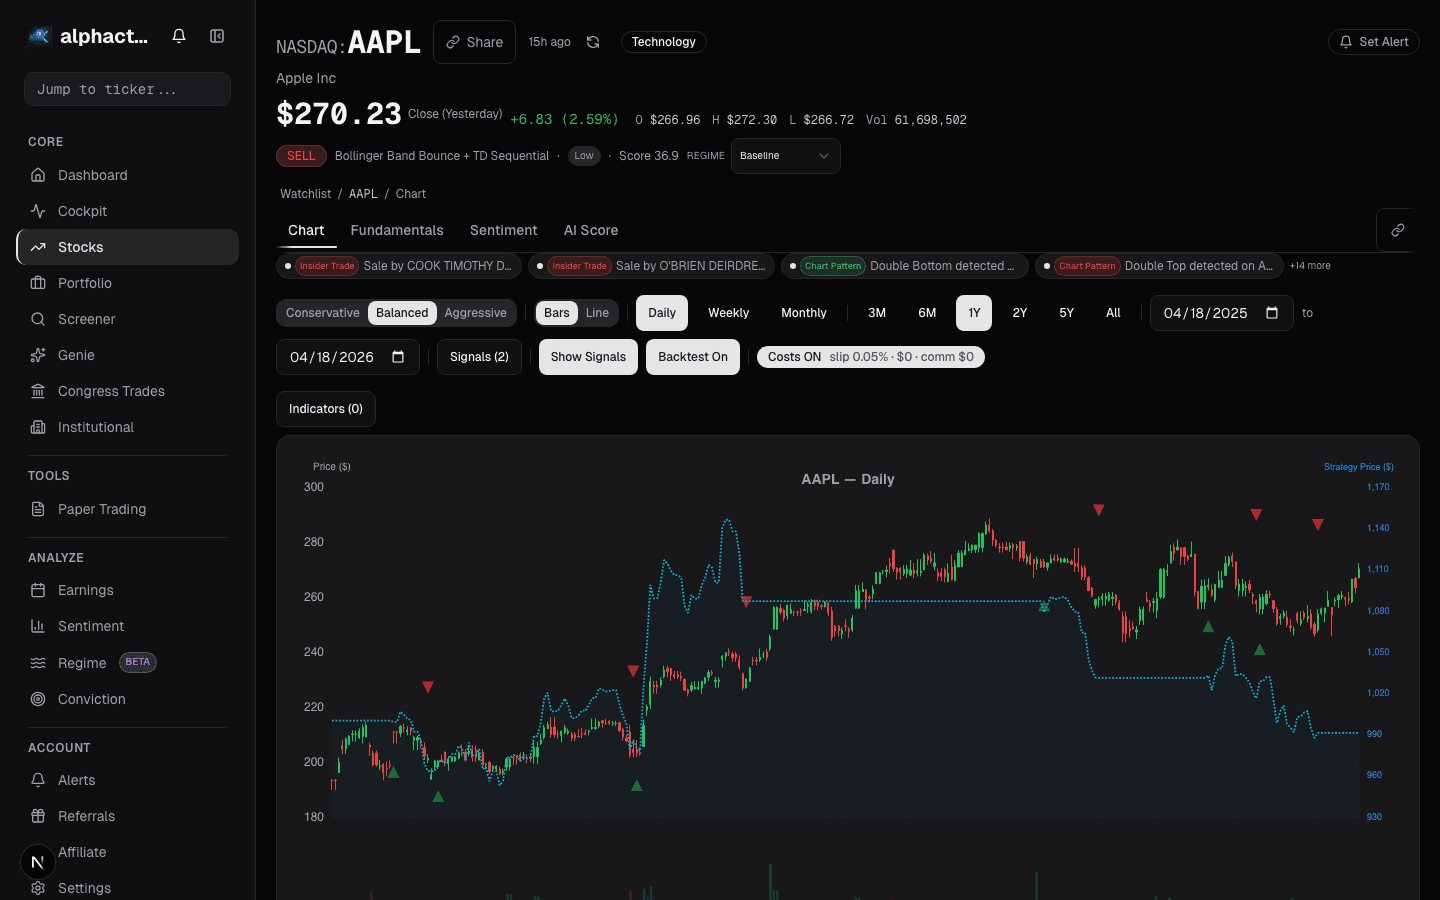
See it in the app
Live dashboard views that match this post. Each tile deep-links to the exact card.


Stocks mentioned
Related reading
How to Build a Watchlist That Beats the Headlines
A practical approach to screening stocks, defining what criteria actually matter, and avoiding the FOMO trap of chasing news-driven momentum.
How to Backtest a Trading Strategy (The Right Way)
Learn how to properly backtest trading strategies, avoid common pitfalls like overfitting, and use statistical credibility testing to validate your results.
Market Regimes: Why One Strategy Can't Do Both
How to identify market regimes using volatility, breadth, and trend data, and why adapting your strategy to the current environment separates consistent…
A Mean Reversion Strategy That Survived Walk-Forward
How a 2-period RSI mean reversion strategy on the S&P 500 held up across 15 years of walk-forward validation, and what the numbers actually look like.
Combining Multiple Signals Into One Strategy
How to merge momentum, value, and quality signals into a single composite score that survives walk-forward testing, with practical rules to avoid the…
The Overnight Edge
From 1993-2024 the S&P 500 overnight component returned 8.9% CAGR with Sharpe 0.71 vs. 1.1% CAGR intraday. Whether the anomaly remains tradable is the question.
Ready to try alphactor.ai?
Validate your trading strategies with statistical credibility testing. Start free.
Get Started Free