A Mean Reversion Strategy That Survived Walk-Forward
How a 2-period RSI mean reversion strategy on the S&P 500 held up across 15 years of walk-forward validation, and what the numbers actually look like.
 Marcus Chen4 min read
The Premise
Mean reversion is the observation that extreme short-term moves tend to reverse. When a stock drops 8% in three days on no material news, the probability of a bounce over the next week is historically elevated. The mechanism is straightforward: short-term selling exhaustion creates temporary mispricings that get corrected as buyers step in.
Larry Connors documented the 2-period RSI strategy in the mid-2000s, and it became one of the most studied retail strategies in quantitative finance. The question is not whether it worked historically. The question is whether it holds up under rigorous walk-forward testing with realistic transaction costs.
Strategy Rules
The variant we tested is deliberately simple. Fewer parameters means less room to curve-fit:
- Universe: SPY (S&P 500 ETF)
- Entry: Buy when 2-period RSI drops below 10 and price is above the 200-day moving average
- Exit: Sell when 2-period RSI crosses above 70
- Position size: 100% of equity (single instrument, so full allocation)
- Period: January 2009 through December 2024
The 200-day moving average filter keeps us out of bear markets. The 2-period RSI identifies short-term oversold conditions within an intact uptrend. The exit at RSI(2) above 70 captures the reversion without waiting for a larger trend move.
Backtest Results
Over 16 years, the strategy triggered 247 round-trip trades on SPY:
- Win rate: 76.1%
- Average winner: +1.9%
- Average loser: -2.3%
- Profit factor: 2.48
- Maximum drawdown: -11.7%
- CAGR: 9.4%
- Average holding period: 4.2 days
Compare this to buy-and-hold SPY over the same period: CAGR of roughly 13.5% with a maximum drawdown of -33.9% (March 2020). The mean reversion strategy returned less in absolute terms but with a fraction of the drawdown. The Sharpe ratio was 1.12 versus 0.78 for buy-and-hold.

The 76% win rate is psychologically comfortable. Most trades work. The losers are slightly larger than winners on average, but the high win rate more than compensates, producing a profit factor of 2.48.
Walk-Forward Results
A single backtest on a single instrument is not evidence. We ran walk-forward testing using Alphactor backtesting with a 36-month in-sample period and a 12-month out-of-sample period, rolling forward in 12-month increments.
Across 12 out-of-sample windows:
- 9 of 12 windows were profitable (75%)
- Walk-forward efficiency ratio: 0.81
- Out-of-sample CAGR: 7.8%
- Out-of-sample max drawdown: -13.2%
An efficiency ratio of 0.81 is strong. It means out-of-sample performance retained 81% of in-sample performance, which suggests the strategy captures a genuine short-term reversion effect rather than noise. The three losing windows occurred in 2015 (choppy, low-volatility regime), late 2018 (sharp Q4 sell-off that whipsawed the 200-day filter), and 2022 (sustained downtrend where the 200-day filter correctly kept us out for most of the year, but entry near transitions caused a few bad trades).
Why This Edge Persists
Mean reversion on major indices is one of the most studied effects in retail quant trading. The natural follow-up question is: if everyone knows about it, why does it persist?
Three structural reasons:
- Behavioral anchoring. When SPY drops 3% in two days, fear spikes. Retail investors sell, and volatility-targeting funds mechanically reduce exposure. This overshooting creates the reversion.
- Institutional rebalancing. Pension funds and balanced portfolios rebalance toward target allocations. A sharp equity decline triggers buying at the margin, providing support.
- Market makers. Designated market makers absorb selling pressure and are compensated through the bid-ask spread. Their inventory management naturally creates short-term mean reversion.
These are structural features of equity markets, not behavioral quirks that get arbitraged away. The edge is small per trade (average winner under 2%), which makes it uneconomical for large hedge funds to pursue aggressively. The capacity constraint protects it.
Limitations and Credibility Testing
This strategy is exposed to gap risk. If SPY gaps down 5% overnight after an RSI(2) entry, the loss is immediate and the exit signal may not trigger for several days. The March 2020 crash is the clearest example: the 200-day filter kept us out for most of the decline, but the initial break below the moving average generated a losing trade.
The strategy was invested only about 40% of the time. The 9.4% CAGR on total equity includes that cash drag.
We ran Monte Carlo simulation with 10,000 reshuffled trade sequences. The 5th percentile CAGR was 5.1%, and the 95th percentile was 14.2%. The median was 9.1%, closely matching the backtest result. This narrow distribution is a hallmark of high-win-rate strategies: the large sample of short-duration trades reduces sequence dependency.
Alphactor's credibility pipeline -- accessible from the Alphactor backtesting results page -- confirmed that the Deflated Sharpe Ratio remained significant at the 95% confidence level even after adjusting for the number of parameter combinations tested. This is the bar that matters: not whether the strategy looks good, but whether the results are statistically distinguishable from luck.
A 2-period RSI mean reversion strategy on SPY is not a retirement plan. It is a building block. Combine it with a trend-following component for diversification across market regimes, and the portfolio-level drawdown profile improves materially. Testing that combination through walk-forward validation before deploying capital is the discipline that separates systematic traders from gamblers with spreadsheets. Start free to run your own walk-forward tests.
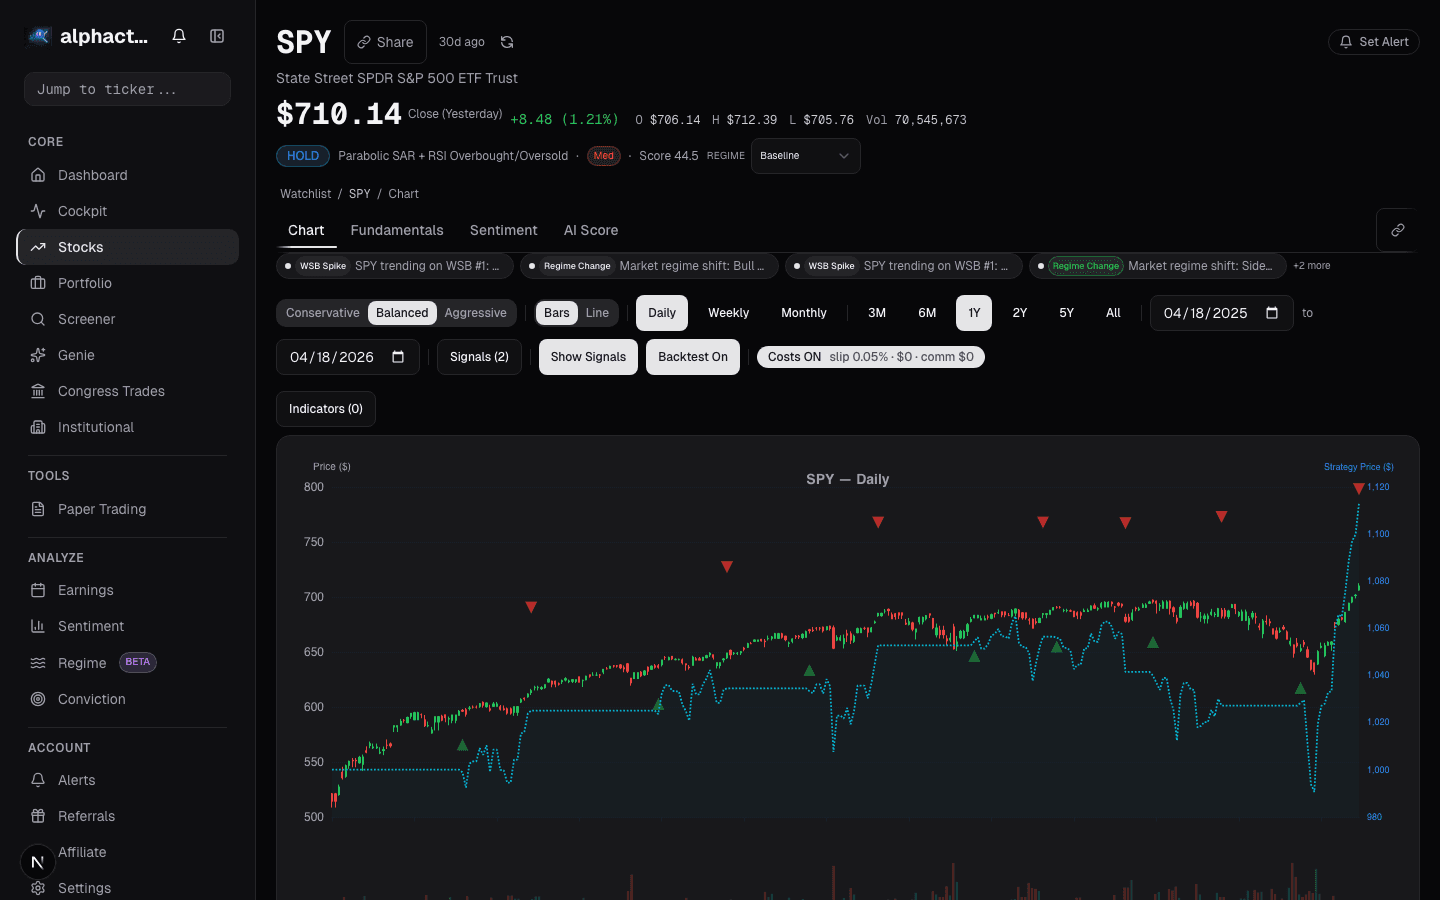
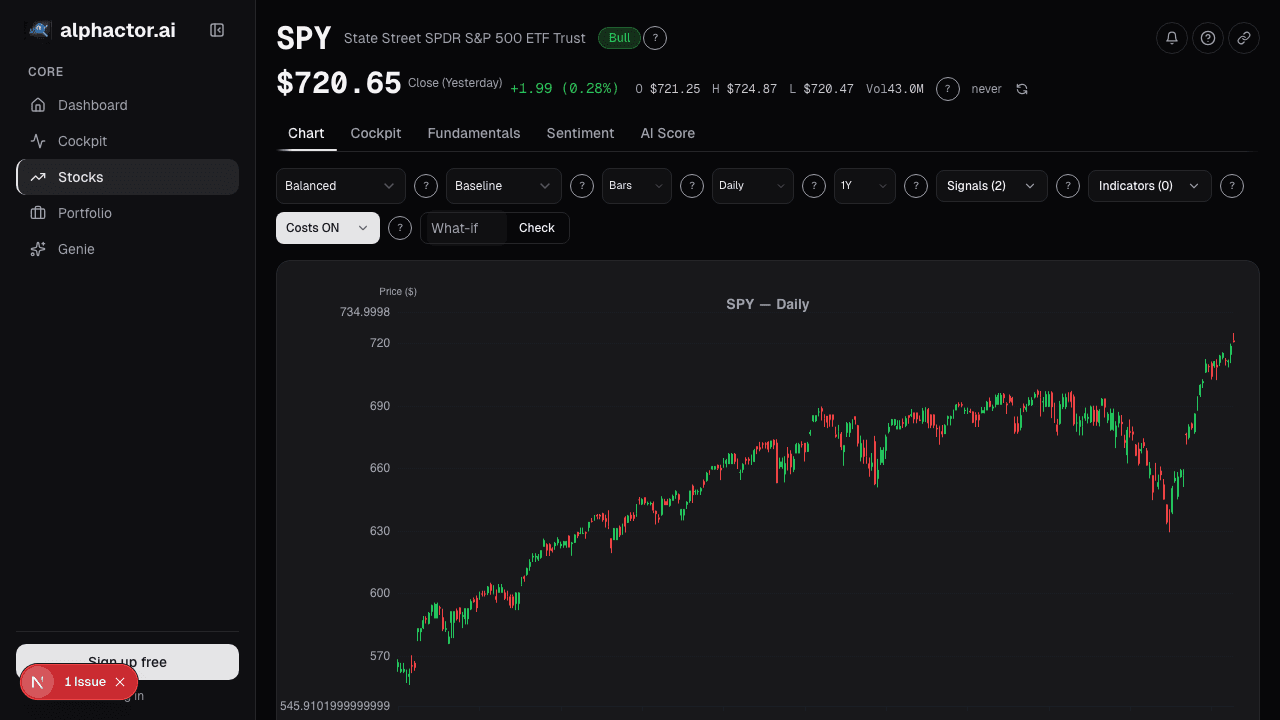
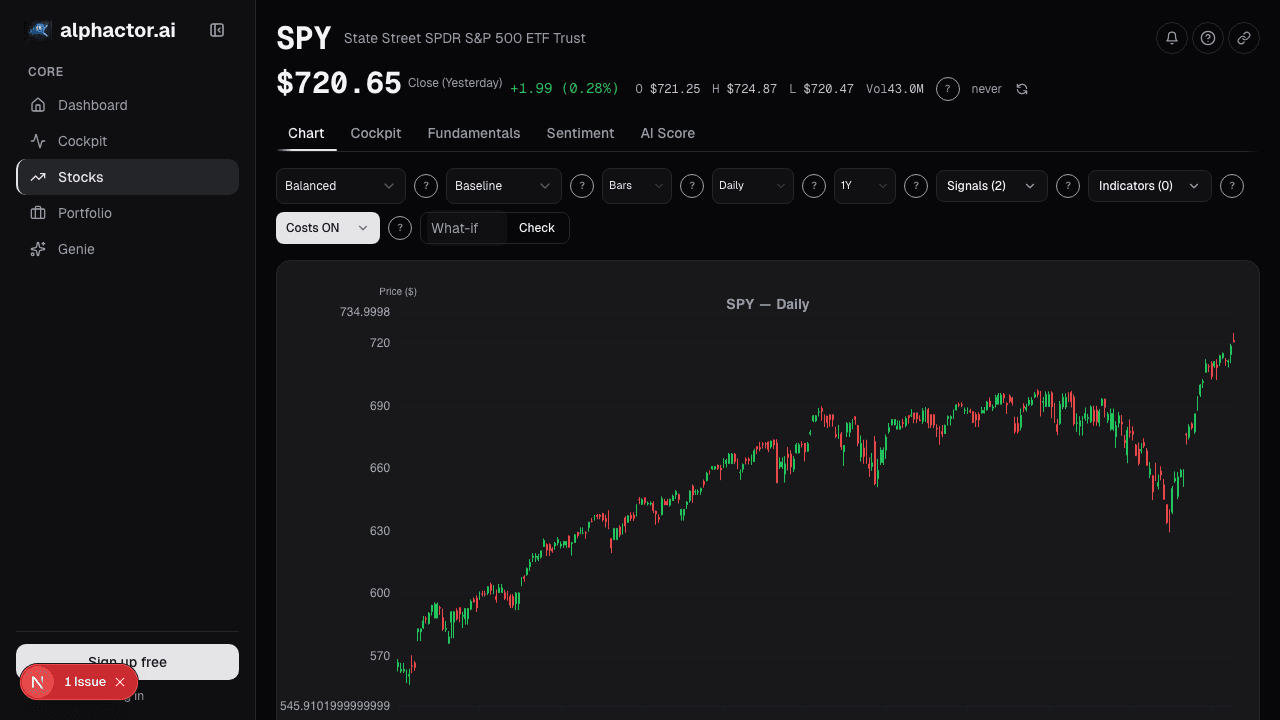
See it in the app
Live dashboard views that match this post. Each tile deep-links to the exact card.
Stocks mentioned
Related reading
Breakout Strategies
A systematic look at breakout trading across 500 stocks over 10 years, with real numbers on win rates, expectancy, and the filters that separate signal from…
How to Backtest a Trading Strategy (The Right Way)
Learn how to properly backtest trading strategies, avoid common pitfalls like overfitting, and use statistical credibility testing to validate your results.
Mean Reversion Signals: Buying the Dip With Math, Not Hope
How to use z-score, Bollinger %B, and RSI extremes as mean reversion triggers, and why the strategy only works in specific market conditions.
Combining Multiple Signals Into One Strategy
How to merge momentum, value, and quality signals into a single composite score that survives walk-forward testing, with practical rules to avoid the…
Regime-Aware Strategy Selection
Markets cycle through trends, ranges, and shocks. Learn how regime detection drives which strategy runs, and why a mixture of experts beats a single static…
Your Trading Signals Have a Noise Problem
Why most trading signals fire too often to be useful, and how to filter with multiple timeframes, volume confirmation, and market regime awareness.
Ready to try alphactor.ai?
Validate your trading strategies with statistical credibility testing. Start free.
Get Started Free