Part of: Technical Analysis
Mean Reversion Signals: Buying the Dip With Math, Not Hope
How to use z-score, Bollinger %B, and RSI extremes as mean reversion triggers, and why the strategy only works in specific market conditions.
 Marcus Chen5 min read
The Problem With "Buy the Dip"
Everyone loves buying the dip until the dip keeps dipping. "Buy the dip" without a quantitative framework is just hope with a brokerage account. I know because I spent two years buying every red candle I saw and wondering why my account was shrinking.
Mean reversion is the statistical foundation behind dip buying. The concept is simple: prices tend to oscillate around a mean (usually a moving average), and extreme deviations from that mean tend to snap back. Rubber band theory. The further price stretches from its average, the more likely a reversal.
But mean reversion has a lethal weakness, and it killed my second trading account in 2015. The strategy works beautifully in range-bound markets and destroys you in trending markets. Before you deploy any mean reversion signal, you need to know which environment you are in.
Three Signals That Measure the Stretch
Z-Score is the purest statistical measure. It tells you how many standard deviations the current price is from its moving average. A z-score of -2 means price is two standard deviations below the mean, which historically captures about 95% of price action. Values beyond -2 or +2 are statistically extreme.
I calculate z-score as: (Price - 20-day SMA) / 20-day standard deviation. When the z-score drops below -2 on a liquid stock in a range-bound market, I start watching for reversal signals. Below -2.5, I am actively looking for entries.
Bollinger %B measures where price sits within the Bollinger Bands. A %B of 0 means price is at the lower band. A %B of 1 means price is at the upper band. Values below 0 or above 1 mean price has breached the bands.
Bollinger %B below 0 is my primary mean reversion trigger for swing trades. It is essentially a visual version of the z-score but normalized to a 0-1 range, making it easier to compare across different stocks. When %B drops below -0.1 (price is 10% beyond the lower band), that is an extreme I pay attention to.
RSI extremes are the most commonly used mean reversion signal. RSI below 30 is the standard "oversold" threshold, though I prefer RSI below 20 for higher-conviction setups. A two-period RSI (RSI-2) developed by Larry Connors is particularly effective for short-term mean reversion, with readings below 5 producing strong bounce statistics on S&P 500 stocks.
When Mean Reversion Works
Range-bound markets. Sideways consolidations. Stocks trading within a defined channel. This is where mean reversion earns its keep.
During 2023, SPY spent months oscillating between roughly $410 and $460. Every dip to the $415-$420 zone with an RSI below 30 and z-score below -2 produced a tradeable bounce. The strategy was almost mechanical: wait for the extreme reading, confirm with a bullish candle, buy, and target the upper end of the range.
I also use mean reversion on large-cap stocks during earnings season. Overreactions to earnings are common, a stock drops 8% on a slight miss and recovers most of it within two weeks. When a high-quality stock like GOOGL or JNJ drops to a z-score of -2.5 on an earnings knee-jerk, the mean reversion setup is often there.
When Mean Reversion Kills You
Trending markets. Sector rotations. Macro-driven selloffs. These are the environments where mean reversion signals fire early and keep firing as price continues to trend against you.
My second account blowup was entirely mean reversion gone wrong. Energy stocks in late 2015 kept triggering every oversold signal in the book. RSI below 20. Z-score at -3. Bollinger %B deep in negative territory. I kept buying the dip because the math said the move was extreme. The math was right about the extremity but wrong about the outcome. Oil went from $60 to $26, and every "extreme" just became the new normal.
The core problem: mean reversion assumes a stable distribution. In trending markets, the distribution itself is shifting. The mean is moving. Reverting to yesterday's mean when today's mean is lower is a recipe for catching falling knives.
The Regime Filter
Before I trade any mean reversion signal, I apply a regime filter to determine whether the market is range-bound or trending.
ADX (Average Directional Index): When ADX is below 20, the market is range-bound and mean reversion strategies have an edge. When ADX is above 30, a trend is in effect and I avoid mean reversion entirely. Between 20 and 30 is ambiguous, and I reduce position sizes.
Moving average slope: If the 50-day SMA is sloping down at more than a 2% decline per month, the trend is bearish and buying dips is fighting the current. Flat to gently rising 50-day SMA is the environment where mean reversion thrives.
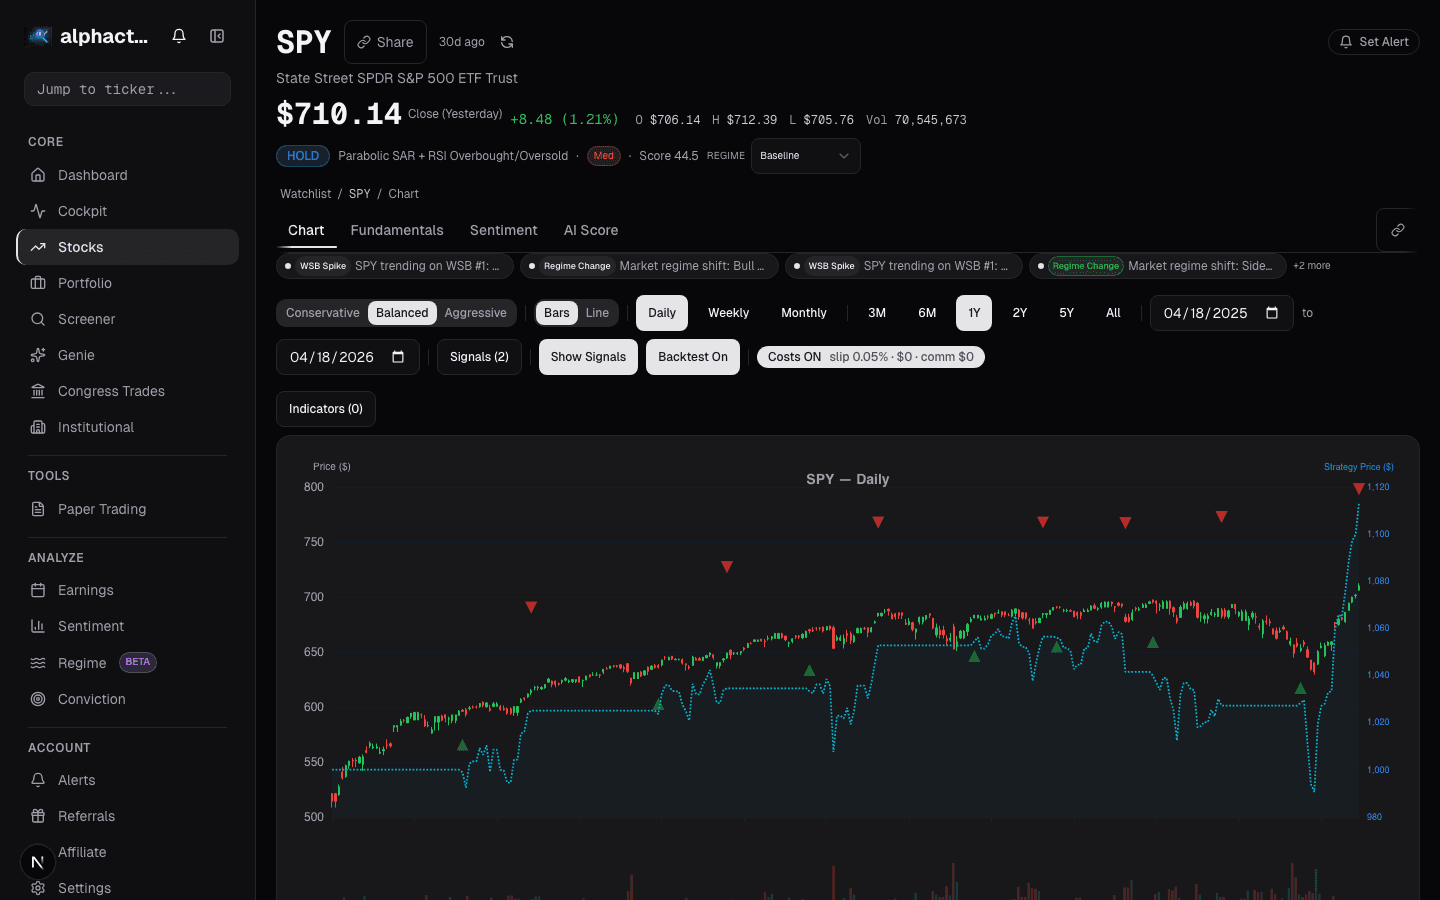
This filter alone would have saved my 2015 account. ADX on the energy sector was above 35 the entire time I was buying dips. I was applying a range-bound strategy in a trending environment. The regime analysis on Alphactor makes this check explicit before you enter any trade.
Putting Signals Together
My mean reversion setup requires at least two of three signals triggering simultaneously:
- Z-score below -2
- Bollinger %B below 0
- RSI-14 below 30
Plus the regime filter showing a non-trending environment (ADX below 25).
When I run backtests on Alphactor backtesting, the combination of multiple mean reversion signals outperforms any single one. This makes sense because each signal captures a slightly different aspect of the extreme: z-score measures deviation from the mean, Bollinger %B measures deviation relative to recent volatility, and RSI measures momentum exhaustion. All three saying "extreme" at the same time is a much higher-conviction setup than any one alone.
The key with mean reversion is discipline around regime. The signals are reliable in the right environment and deadly in the wrong one. Know which market you are in before you trust the math.
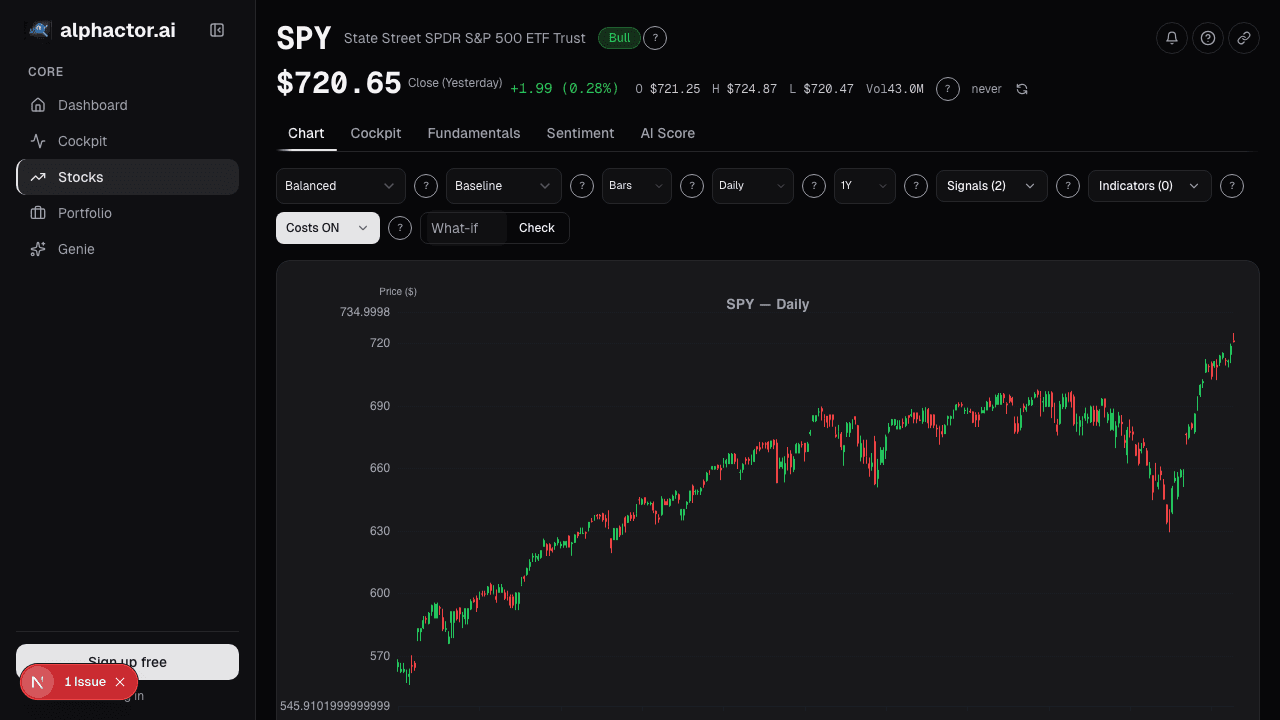
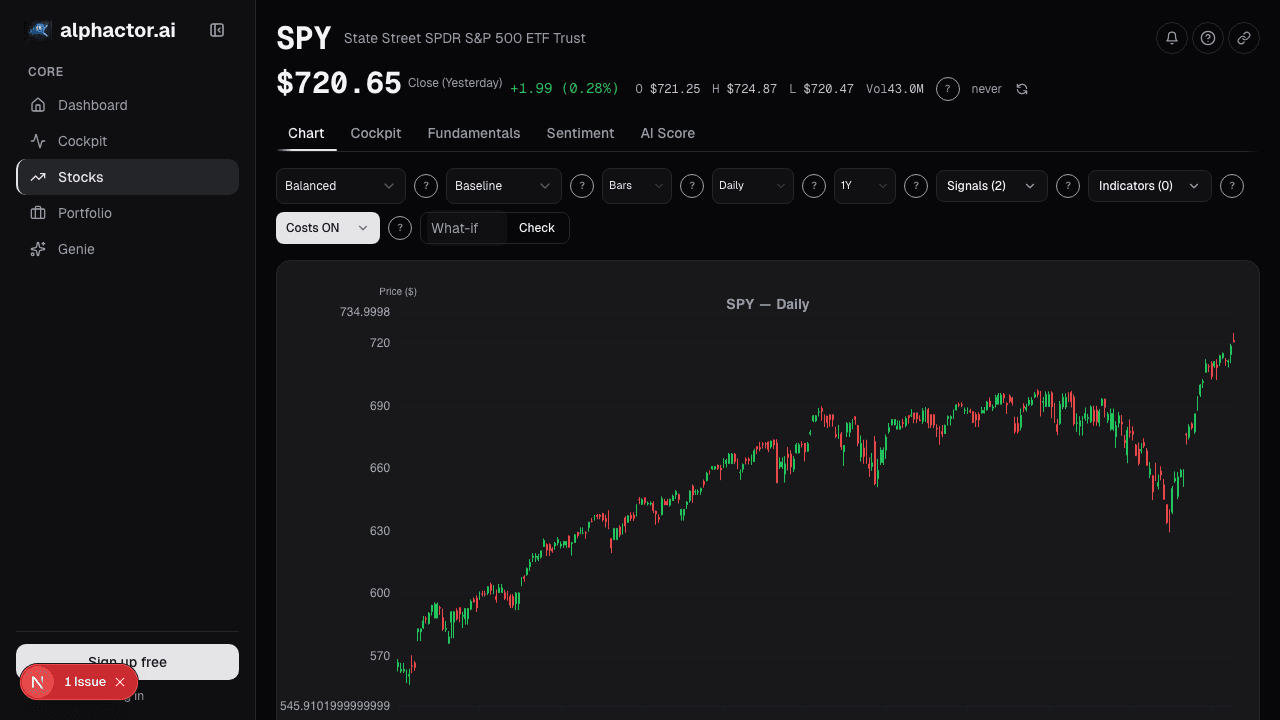
See it in the app
Live dashboard views that match this post. Each tile deep-links to the exact card.


Stocks mentioned
Related reading
Cockpit Cards: Quick-Glance Intelligence per Stock
How cockpit cards surface the signals, events, and changes that matter most across your watchlist and portfolio without information overload.
A Mean Reversion Strategy That Survived Walk-Forward
How a 2-period RSI mean reversion strategy on the S&P 500 held up across 15 years of walk-forward validation, and what the numbers actually look like.
Combining Multiple Signals Into One Strategy
How to merge momentum, value, and quality signals into a single composite score that survives walk-forward testing, with practical rules to avoid the…
Regime-Aware Strategy Selection
Markets cycle through trends, ranges, and shocks. Learn how regime detection drives which strategy runs, and why a mixture of experts beats a single static…
Your Trading Signals Have a Noise Problem
Why most trading signals fire too often to be useful, and how to filter with multiple timeframes, volume confirmation, and market regime awareness.
Ready to try alphactor.ai?
Validate your trading strategies with statistical credibility testing. Start free.
Get Started Free