The Overnight Edge
From 1993-2024 the S&P 500 overnight component returned 8.9% CAGR with Sharpe 0.71 vs. 1.1% CAGR intraday. Whether the anomaly remains tradable is the question.
 Marcus Chen4 min read
The Anomaly
If you had bought SPY at every market close and sold at the next market open from 1993 through 2024, your cumulative return would have been approximately 1,050%. If you had done the opposite (bought at the open, sold at the close), your cumulative return would have been roughly -20%.
This is the overnight return anomaly, and it is one of the most striking patterns in equity markets. Nearly all of the S&P 500's long-term return has accrued during the 17.5 hours when the U.S. stock market is closed, not during the 6.5 hours of regular trading.
The data is not ambiguous. Cliff Asness at AQR, academics at NYU, and multiple independent researchers have documented this effect across decades of data and multiple international markets. The effect is real. The question is why, and whether it is tradable.
Decomposing the Numbers
We decomposed SPY returns into overnight (close-to-open) and intraday (open-to-close) components from January 1993 through December 2024:
- Total SPY CAGR: ~10.1%
- Overnight component CAGR: ~8.9%
- Intraday component CAGR: ~1.1%
- Overnight Sharpe ratio: 0.71
- Intraday Sharpe ratio: 0.09
The overnight component captured approximately 88% of total returns with a Sharpe ratio nearly 8x higher than the intraday component. The intraday session barely compensated for transaction costs.
Breaking it down further by decade:
- 1993-2003: Overnight CAGR 7.2%, Intraday CAGR 1.8%
- 2004-2014: Overnight CAGR 9.1%, Intraday CAGR -0.3%
- 2015-2024: Overnight CAGR 10.4%, Intraday CAGR 1.9%
The effect has been persistent across all three decades, and if anything, it has strengthened in recent years.
Why Does This Exist?
Several non-mutually-exclusive explanations have been proposed:
1. Earnings and macro announcements. Most corporate earnings and macroeconomic data are published outside trading hours. These tend to be net positive surprises over time, and the overnight session captures the price adjustment.
2. Inventory risk compensation. Market makers holding long positions overnight bear the risk of adverse events. The overnight premium compensates them.
3. Short seller mechanics. Short sellers close positions at end of day to avoid overnight carrying costs and re-short in the morning, creating net buying pressure at the close and net selling pressure at the open.
4. Retail order flow. Retail buy orders arrive disproportionately at market open, pushing prices up. The mean reversion during the day pushes them back down.
Can You Trade It?
A pure close-to-open strategy on SPY faces practical constraints. Bid-ask spreads compound to roughly 1.0% annually over 252 trading days. Margin interest erodes the edge further. And 252 short-term trades per year means all gains are taxed at ordinary income rates. After accounting for friction and taxes, a naive close-to-open strategy on SPY produces roughly 5-7% net returns, which is still positive but below buy-and-hold on a tax-adjusted basis.
A More Practical Application
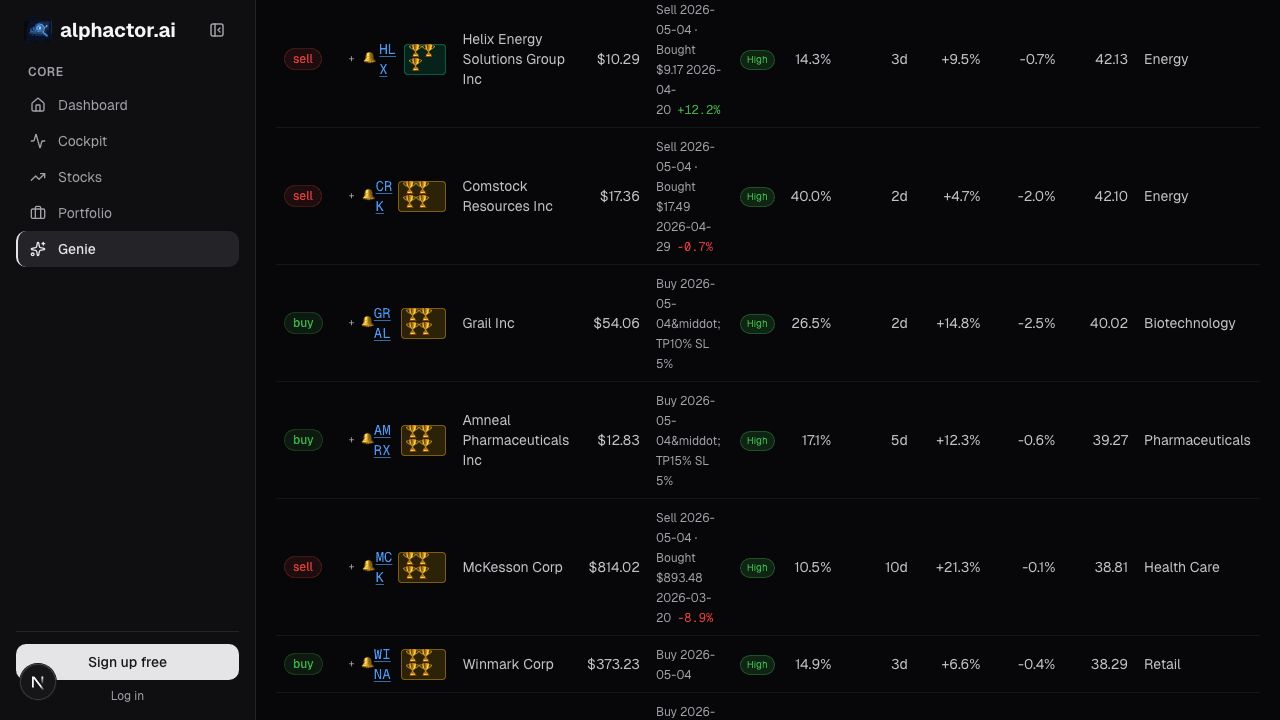
The overnight anomaly is more useful as a filter than as a standalone strategy. When we applied it to a stock selection framework using the universe scanner, the results were more compelling:
We screened for stocks in the S&P 500 with the highest overnight-to-intraday return ratios over the trailing 60 days. These are stocks where the overnight premium is most pronounced. Holding the top quintile (100 stocks) by this ratio and rebalancing monthly produced:
- CAGR: 13.8% (vs. 10.1% for SPY)
- Maximum drawdown: -38.2%
- Sharpe ratio: 0.72
The excess return of 3.7% annually over SPY suggests that the overnight premium varies across stocks and that ranking by it captures a meaningful signal. Stocks with strong overnight returns tend to be the ones experiencing positive fundamental news flow and institutional accumulation, both of which are associated with future outperformance.
Combining With Other Signals
The overnight return signal has low correlation with standard factors like value, momentum, and quality. When we added it as a secondary filter to a multi-factor stock selection model (value + momentum + overnight return quintile), the combined strategy produced a CAGR of 15.2%, a maximum drawdown of -31.4%, and a Sharpe ratio of 0.88. Walk-forward testing via Alphactor backtesting confirmed: the combined model maintained an efficiency ratio of 0.71 across 15 out-of-sample periods.
The Systematic Takeaway
The overnight return anomaly is empirically robust, economically rationalized, and has persisted for over 30 years. As a standalone trading strategy, practical frictions reduce the net edge to marginal levels. As a stock selection signal within a broader systematic framework, it adds real value.
The deeper lesson is that anomalies rarely translate into simple strategies. The gap between "this pattern exists in the data" and "this pattern produces risk-adjusted returns after costs" is where most retail traders lose money. Testing the full implementation through Alphactor backtesting and Monte Carlo simulation is what separates research from trading.
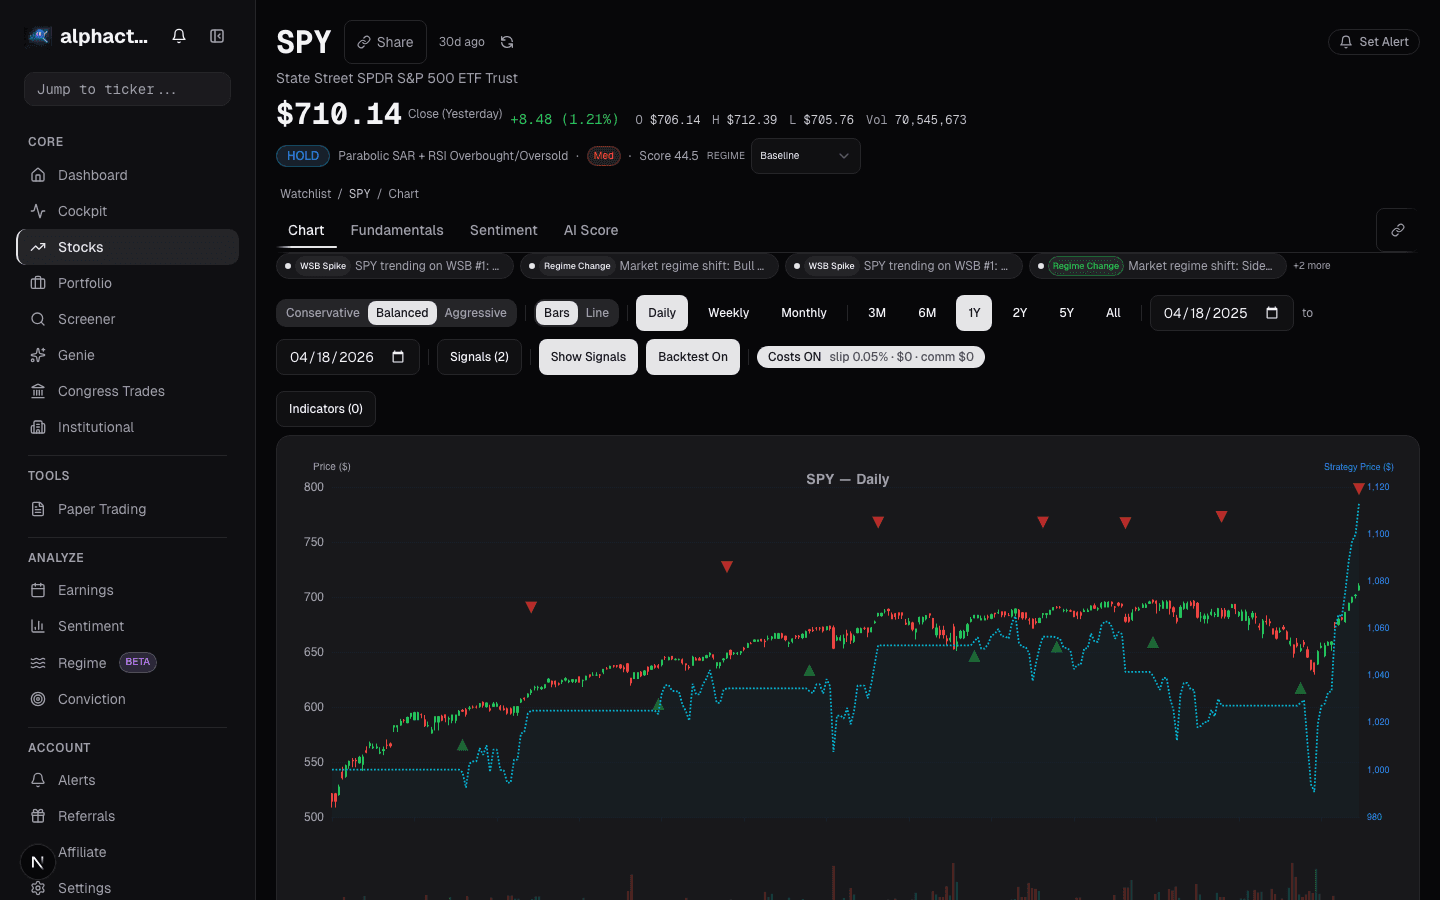
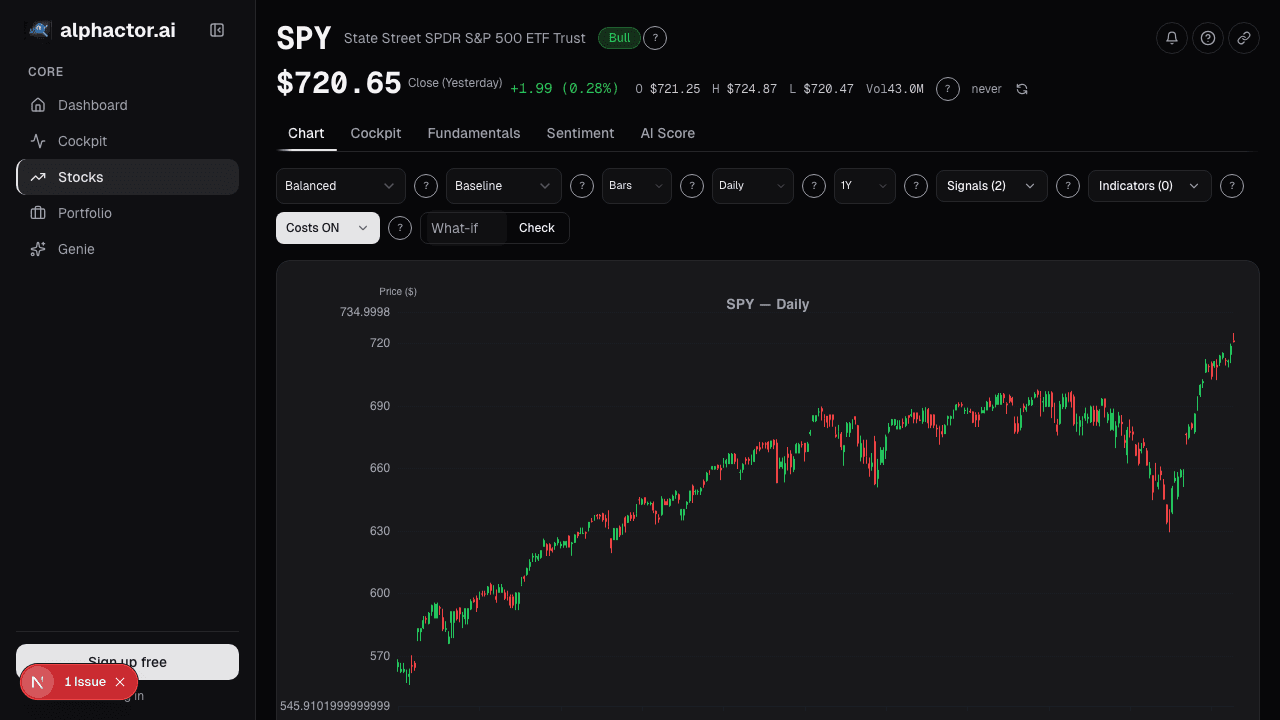
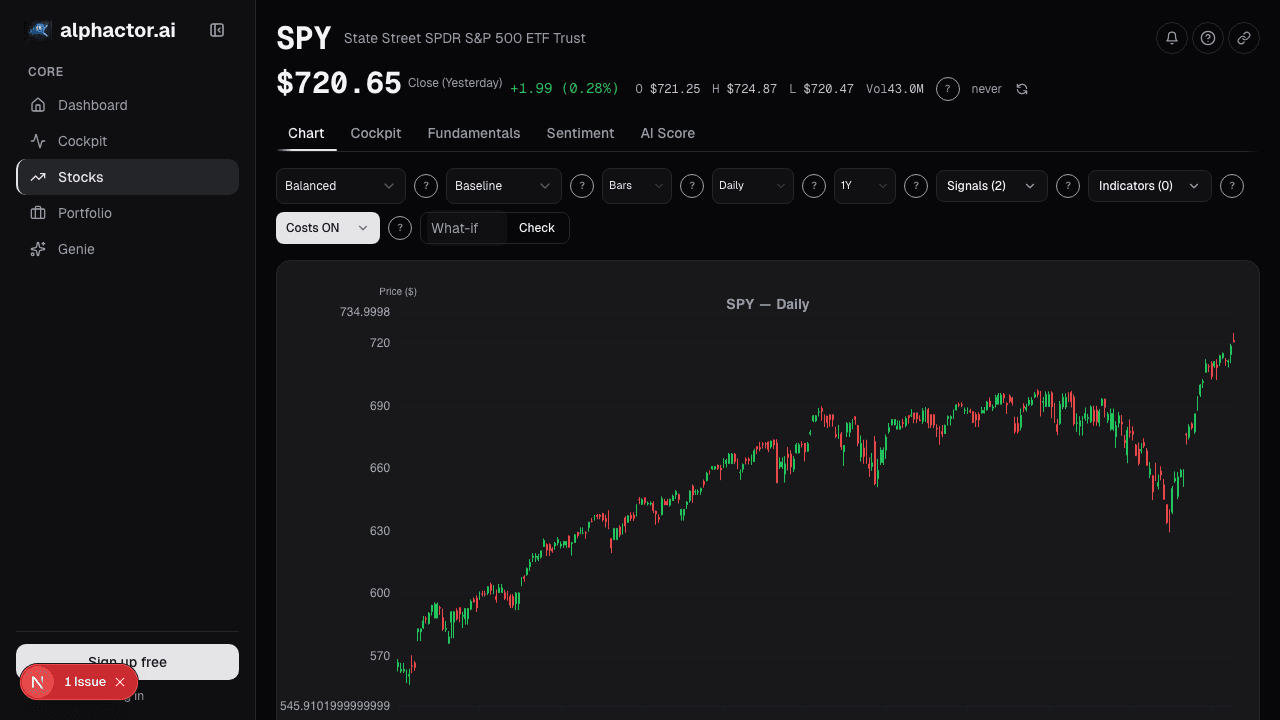
See it in the app
Live dashboard views that match this post. Each tile deep-links to the exact card.
Stocks mentioned
Related reading
Breakout Strategies
A systematic look at breakout trading across 500 stocks over 10 years, with real numbers on win rates, expectancy, and the filters that separate signal from…
The 10-Minute Daily Stock Research Workflow
A structured daily routine for checking your portfolio, reviewing signals, and identifying new opportunities in under ten minutes.
Regime-Aware Strategy Selection
Markets cycle through trends, ranges, and shocks. Learn how regime detection drives which strategy runs, and why a mixture of experts beats a single static…
What Is a Stock Universe and How Smart Investors Use One
How defining a stock universe sharpens your research process, reduces noise, and helps you focus on opportunities that match your strategy.
Turn Your Watchlist Into an Active Research System
A passive watchlist wastes your time. Learn how to turn yours into a system that surfaces actionable intelligence on the stocks you care about.
Ready to try alphactor.ai?
Validate your trading strategies with statistical credibility testing. Start free.
Get Started Free