Part of: Risk Management
Why Maximum Drawdown Is More Important Than Annual Return
Maximum drawdown reveals what your portfolio almost did to you. Here is why it matters more than the number everyone brags about.
 Marcus Chen4 min read
The Number Nobody Puts on Their Business Card
Ask a trader how they did last year and they will tell you their return. Ask them their maximum drawdown and you will get a blank stare or a subject change. This tells you everything about what retail investors optimize for and why so many of them eventually blow up.
Annual return measures what you made. Maximum drawdown measures what you almost lost. The first number is a highlight reel. The second is a survival metric. If you can only track one, track the one that keeps you in the game.
What Maximum Drawdown Actually Measures
Maximum drawdown (MDD) is the largest peak-to-trough decline in your portfolio value before a new peak is reached. If your portfolio went from $100,000 to $130,000 to $91,000 to $145,000, your maximum drawdown was 30%, the drop from $130,000 to $91,000.
That single number tells you several things at once:
The worst experience you delivered. Whatever your annualized return, your investors (or you) had to sit through a 30% decline at some point. That is the real cost of your strategy, not in dollars but in psychological endurance. Most people cannot sit through a 30% drawdown without making irrational decisions.
Your strategy's fragility. A 30% MDD means your strategy has the structural capacity to lose 30% or more under certain conditions. Those conditions will return. History does not repeat, but drawdown magnitudes tend to get revisited.
Your distance from ruin. A strategy with a 50% MDD is always one bad sequence from becoming unsurvivable. The next drawdown might be 60%. The one after that might be the one where you run out of capital, margin, or willpower.
The Return-Drawdown Tradeoff Nobody Discusses
Consider two hypothetical strategies over 10 years:
Strategy A: 20% annualized return, 50% maximum drawdown.
Strategy B: 14% annualized return, 18% maximum drawdown.
Most retail traders would pick Strategy A without hesitation. The return is 6% higher annually. Over a decade, that compounds to a significant difference in terminal wealth. On paper.
In practice, Strategy A requires you to sit through a 50% drawdown at some point. That means watching $500,000 become $250,000 and not flinching. Not selling. Not revenge trading to make it back. Not lying awake calculating how many years of gains you just erased. Most people cannot do this. The data confirms it: Dalbar's annual studies consistently show that the average equity fund investor underperforms the funds they invest in by 3-4% annually, almost entirely because they sell during drawdowns and buy back after recoveries.
Strategy B lets you sleep. An 18% drawdown is unpleasant but survivable. You are far more likely to stay the course, which means you actually capture the 14% annualized return instead of the 8% you would have captured from Strategy A after panic selling at the bottom.
Real World: The Medallion Fund Lesson
Renaissance Technologies' Medallion Fund is the greatest trading operation in history. From 1988 to 2018, it generated roughly 66% annualized returns before fees. Its maximum drawdown during that period was reportedly around 10-11%.
Read that again. The best fund in history optimized ruthlessly for drawdown control. Jim Simons did not build a system to maximize returns. He built a system that never lost enough to threaten its survival, and then compounded from that foundation for decades.
The firms that chase maximum returns without drawdown constraints are the ones that make the news. Long-Term Capital Management returned 40% annualized for four years before a drawdown destroyed the firm and nearly took down the financial system with it. Bill Hwang's Archegos turned $200 million into $36 billion before losing everything in two days. The return was spectacular. The drawdown was terminal.
How to Use Maximum Drawdown
Evaluate strategies by their Calmar Ratio. The Calmar Ratio is annualized return divided by maximum drawdown. Strategy A above has a Calmar of 0.4 (20% / 50%). Strategy B has a Calmar of 0.78 (14% / 18%). Strategy B is the better risk-adjusted strategy by a wide margin despite the lower headline return. Alphactor backtesting reports both Calmar and Sharpe ratios alongside maximum drawdown so you can compare strategies on a level playing field.
Set a maximum acceptable drawdown before you start trading. Decide what you can genuinely tolerate. Not what you think you should tolerate. Not what seems reasonable on a spreadsheet. What you can actually sit through without changing your behavior. For most retail investors, that number is 15-20%. If your strategy's historical MDD exceeds your tolerance, reduce leverage or position sizes until it fits.
Track rolling drawdown in real time. Do not wait for quarterly statements to discover you are in a 25% hole. Your portfolio dashboard gives you a live view of your current drawdown from peak, so you can act before the numbers get unrecoverable.
Compare your drawdown to the market's. If the S&P 500 dropped 20% and your portfolio dropped 35%, your active decisions made things worse, not better. That is critical feedback. If you are taking on more drawdown than a passive index, you need to be generating significantly more return to justify it.
The Bottom Line
Annual return is what you tell people at parties. Maximum drawdown is what determines whether you will still be investing five years from now. The traders who compound wealth over decades are not the ones with the best years. They are the ones who avoided the worst ones.
Track your drawdown. Respect the math. The return will follow.
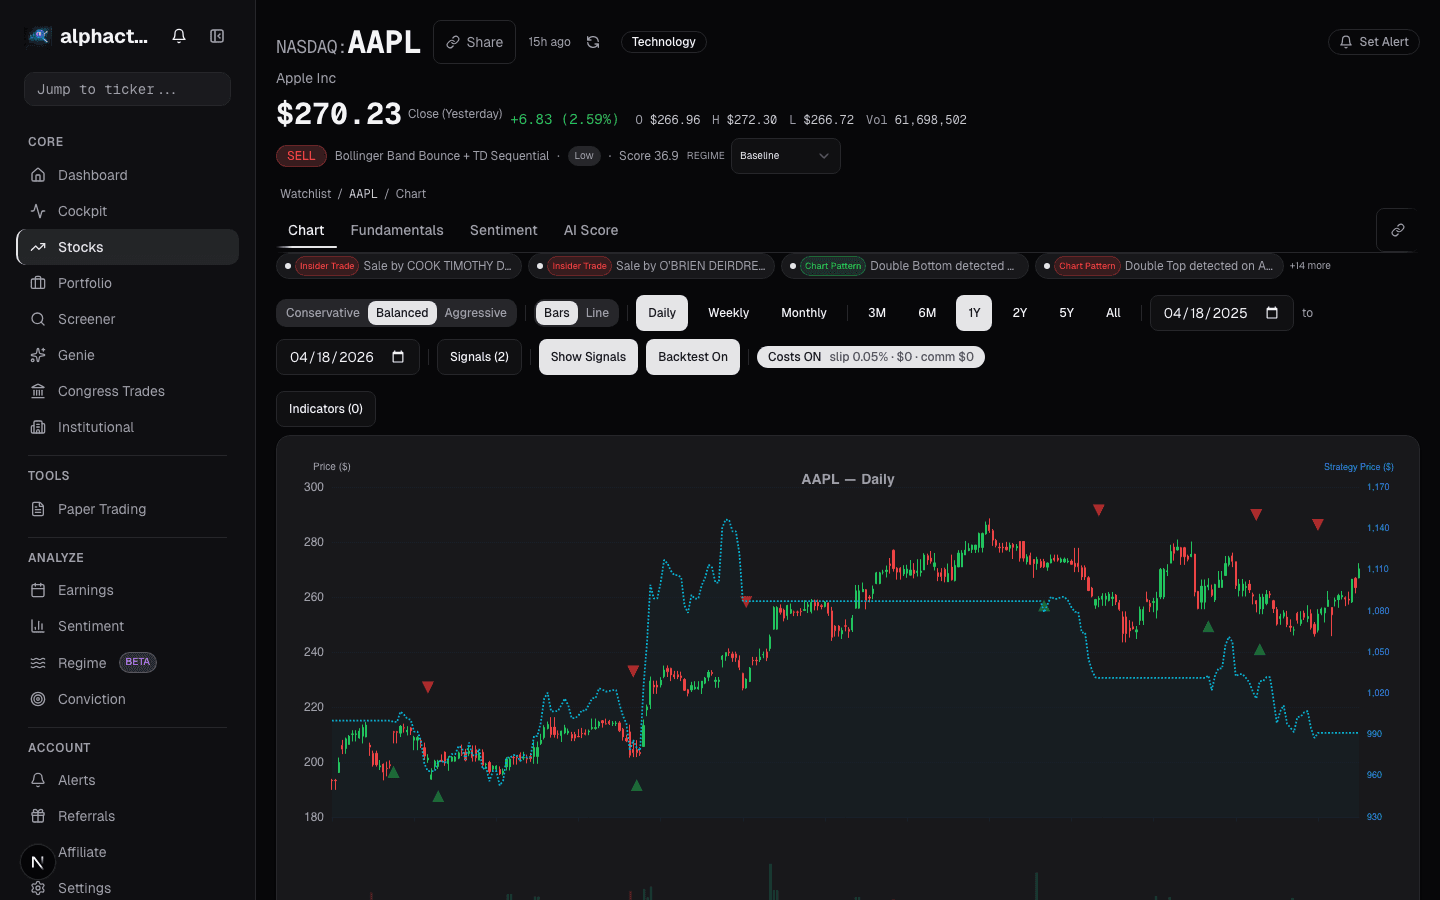
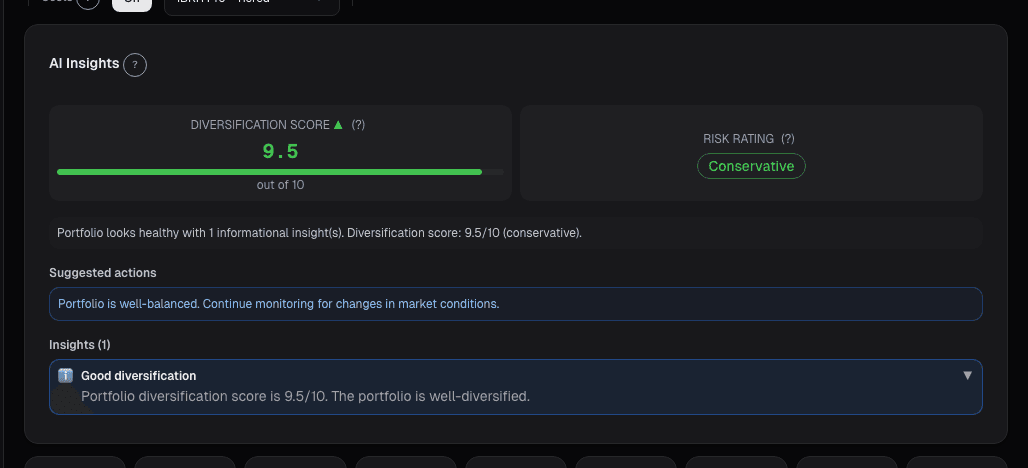
See it in the app
Live dashboard views that match this post. Each tile deep-links to the exact card.


Stocks mentioned
Related reading
In a Crisis, All Correlations Go to One
Diversification fails exactly when you need it most. Here is why correlations spike during crises and how to build portfolios that survive it.
A 30% Drawdown Requires a 43% Gain to Recover
A 30% drawdown requires a 43% gain to recover. The asymmetric math explained, with sizing rules to prevent one bad trade from permanently impairing the account.
Portfolio Attribution: Where Your Returns Actually Come From
Beating the benchmark by 400bps feels good until attribution tells you it was all allocation luck on one sector call. Selection vs. allocation vs.
Portfolio Earnings: Calendar, Exposure
Earnings risk is about the whole book into the week, not each position. When 40% of NAV reports in one week, and 60% of that is in a single sector, you're…
Factor Exposure
Factor exposures are bets whether or not you chose them. Decomposition surfaces unintentional tilts before a rotation exposes them as underperformance.
Ready to try alphactor.ai?
Validate your trading strategies with statistical credibility testing. Start free.
Get Started Free