Part of: Risk Management
FX Exposure: The Currency Risk Hiding in Your USD Portfolio
You bought US stocks in dollars, so you have no FX risk, right? Wrong. US large-cap multinationals earn 40-60% of revenue abroad.
 Marcus Chen6 min read
In Q3 2022 the dollar index rallied about 7% in 90 days, and my portfolio underperformed its expected benchmark return by 190 bps in the same window. My initial read was that a couple of individual positions had weakened on earnings, and I spent an afternoon on fundamentals reviews that didn't find anything concerning. A colleague suggested I run the FX exposure decomposition on the book, and the real driver showed up immediately. The portfolio had about 34% of its implicit revenue exposure in non-USD currencies, mostly EUR, GBP, JPY, and CNY, concentrated in the large-cap tech and consumer names that dominate most US equity books. A 7% DXY move, with an implicit FX beta of roughly 0.4 on the non-USD revenue exposure, costs the portfolio about 1.6-1.8% in translation effects before any operating leverage. The underperformance wasn't stock-specific; it was an FX drag I'd never explicitly sized. I was running an implicit short-dollar bet at 34% of NAV without knowing it. The fix wasn't to hedge, at that scale, an explicit hedge wouldn't have been worth the cost, but to stop being surprised by it, and to size differently when the dollar regime was clearly in play. Once I could name the exposure, I stopped misattributing macro effects to individual names.
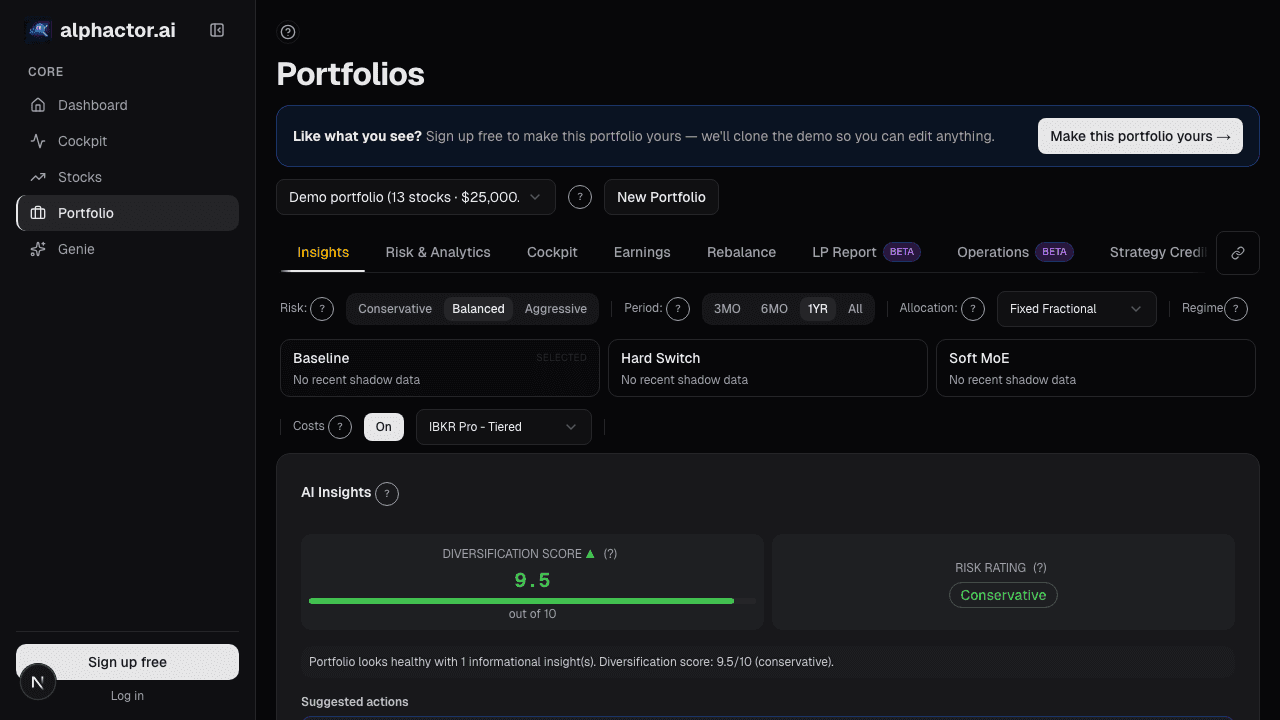
This post is about the FX Exposure card, why a USD-denominated portfolio still has material FX risk, and the two uses of the decomposition that separate "hedged correctly" from "surprised by macro."
TL;DR
- USD portfolios have 25-40% implicit non-USD exposure through multinational revenue mix.
- DXY sensitivity can cost 150-200 bps in a 5% dollar rally quarter: material attribution.
- Hedge sizing depends on whether the exposure is already indirect. Long US stocks = partial long non-USD; don't double-hedge.
- Earnings translation effects are sector-mix, not company-specific. Distinguishing them is the use-case.
- Geographic revenue mix from 10-K segments is the data layer, not all names disclose the same quality.
The exposure you didn't think you were taking
The myth is that a USD-funded, USD-listed portfolio has no FX risk. In practice, the companies you bought earn revenue all over the world and report it in USD after translation. When the dollar strengthens, that foreign revenue translates down, a pure FX drag on reported earnings that has nothing to do with the underlying business. When the dollar weakens, the opposite: foreign revenue translates up, flattering reported numbers without any business improvement.
For a diversified US large-cap portfolio, implicit non-USD revenue exposure is typically 25-40% of total revenue exposure. The specific currencies depend on sector mix:
- Large-cap tech: heavy EUR, GBP, JPY, CNY through global enterprise and consumer businesses
- Consumer staples: broad EM exposure through emerging-market volume growth
- Industrials: heavy EUR and JPY through global capex customers
- Energy: priced in USD but operations often in EUR, GBP, NOK, BRL, CAD
The implication is that the portfolio has an implicit FX beta that can dominate quarterly returns in a strong-regime DXY move. In an 8% DXY rally, a 35%-non-USD portfolio with a translation FX beta of 0.4 gives up roughly 1.1% to pure translation drag, enough to turn a 2% quarter into a barely-positive one, or a flat quarter into a loss. That's big enough that you need to know you're taking it.
What the FX Exposure card shows
The FX Exposure card uses each holding's geographic revenue disclosure (10-K segment notes where available, MSCI-normalized country mapping otherwise) to compute your book's implicit currency exposure:
- Currency-basket breakdown: USD, EUR, GBP, JPY, CNY, CHF, CAD, and emerging-market aggregate as a % of total revenue exposure
- Geographic-region breakdown: North America, Europe, APAC, China specifically, LatAm, etc.
- DXY sensitivity: the estimated portfolio return impact of a 1% move in the dollar index
- Scenario strip: estimated P&L impact from a 5% dollar strength or weakness
- Position-level contribution: which names contribute the most to each currency bucket
- Coverage warning: flags when a position's geographic disclosure is incomplete or stale
Two uses that actually change decisions
Sizing the hedge correctly. If you're bearish on the dollar and long a US-listed portfolio with 35% implicit non-USD revenue exposure, your book is already partially long non-USD through multinational earnings. An explicit FX hedge would be incremental, not foundational, and sized too aggressively, it would over-hedge. Conversely, if you're bullish on the dollar, your US-listed portfolio is already running a structural headwind you don't need to add to. The decomposition tells you whether an explicit hedge is additive or redundant.
Earnings-season attribution. When the dollar rallies 4%+ in a quarter, names with 50%+ foreign revenue exposure will guide down on translation. This is a sector-mix effect, not a company-specific miss. Reading the exposure in advance lets you distinguish "the business is weakening" from "the dollar is strengthening" in your P&L attribution. Without the decomposition, you're prone to misattributing macro to stock-specific, which leads to trimming good names at the wrong time.
Example: my Q3 2022 attribution
The decomposition of my portfolio at the start of Q3 2022:
| Currency | % of Revenue Exposure | DXY Beta |
|---|---|---|
| USD | 66% | 0 (base) |
| EUR | 14% | -0.45 |
| GBP | 4% | -0.40 |
| JPY | 6% | -0.50 |
| CNY | 5% | -0.30 |
| Other EM | 5% | -0.35 |
Weighted-average translation beta on the non-USD 34%: about -0.42. With a 7% DXY rally in the quarter, expected translation drag: 34% × 7% × 0.42 = roughly 1.0% pure translation, plus some operating-leverage effects on top. Actual portfolio underperformance vs. benchmark: 1.9%. About half of the underperformance was the FX drag; the remainder was position-specific. Before running the decomposition, I'd attributed all 1.9% to individual names. The decomposition reallocated about 1.0% to macro and saved me from trimming positions I later kept.
What the FX card can miss
- Operational FX hedges by the companies themselves. Many multinationals hedge a portion of foreign revenue internally; the card shows gross exposure, not net of corporate hedging.
- Transaction vs. translation exposure. The card focuses on revenue translation; the transaction (cost-side) exposure can differ.
- Stale disclosures. Geographic revenue is 10-K annual; quarterly shifts aren't captured.
- Implicit competitive effects. A strong dollar hurts US-exporter revenue directly but also their competitiveness; second-order effects aren't modeled.
- Non-listed exposures. Private subsidiaries and minority investments don't appear in the public disclosure.
Common mistakes
- Assuming USD listing = USD exposure. The listing currency is a payment currency; the revenue base is what matters.
- Hedging gross without considering implicit offsets. A long-US-stocks book is already partially long non-USD via revenues; explicit hedges should be sized net.
- Attributing FX-driven quarters to stock-picking skill. A weak-dollar quarter flatters everyone's US-listed multinationals; credit the dollar, not the picker.
- Ignoring EM exposure. EM currencies can move 15-25% in a year; even small EM revenue exposure can surprise when the dollar rips.
- Treating DXY as the only FX benchmark. DXY is EUR-heavy; for APAC-heavy books, DXY isn't the right benchmark, use a trade-weighted dollar or direct JPY/CNY tracking.
Where it fits
Pair with Regime Analysis, FX regimes (strong-dollar vs. weak-dollar) are one of the macro regimes that drive factor rotations. Cross-reference with Factor Analysis, since US large-cap tech tilts your book toward global FX exposure even when your factor tilts look neutral. For the book-level earnings risk into a dollar-driven quarter, use Portfolio Earnings to see which prints will be most translation-exposed.
FAQ
How often does the card update?
Currency breakdowns update on position changes (immediately) and on 10-K filings (annually). DXY sensitivity is recomputed daily.
What's the data source for geographic revenue?
Primary: 10-K segment notes where companies disclose it. Secondary: MSCI's revenue-by-country mapping for names without direct disclosure.
Does it handle ADRs correctly?
Yes, ADRs are mapped to the home-country revenue currency, not USD.
Can I hedge directly from the card?
Not directly, the card shows exposure. FX hedging execution requires a separate broker integration.
What about non-USD-listed holdings?
The card handles multi-currency portfolios; USD-base reporting is the default, with toggle for other base currencies.
Related reading
Open the FX Exposure card → /app/portfolio
See it in the app
Live dashboard views that match this post. Each tile deep-links to the exact card.


Related reading
In a Crisis, All Correlations Go to One
Diversification fails exactly when you need it most. Here is why correlations spike during crises and how to build portfolios that survive it.
Portfolio Earnings: Calendar, Exposure
Earnings risk is about the whole book into the week, not each position. When 40% of NAV reports in one week, and 60% of that is in a single sector, you're…
Factor Exposure
Factor exposures are bets whether or not you chose them. Decomposition surfaces unintentional tilts before a rotation exposes them as underperformance.
A Position Sizing Framework That Won't Keep You Up at Night
A practical position sizing approach built on simplified Kelly criterion, risk-per-trade limits, and portfolio-level allocation guardrails.
The 5 Position Sizing Mistakes That Blow Up Accounts
Position sizing errors kill more accounts than bad stock picks. Here are the five most common mistakes and how to avoid each one.
Risk Management for Retail Portfolios
Practical position sizing, stop-loss strategies, correlation awareness, and drawdown limits for retail investors managing their own money.
Ready to try alphactor.ai?
Validate your trading strategies with statistical credibility testing. Start free.
Get Started Free