Part of: Risk Management
Value at Risk in Plain English
VaR is the most widely used risk metric in finance. It is also the most misunderstood. Here is what it actually means and where it fails.
 Marcus Chen4 min read
What VaR Actually Says
Value at Risk answers one specific question: what is the maximum I expect to lose over a given time period, at a given confidence level, under normal market conditions?
A 1-day 95% VaR of $10,000 means: on 95% of trading days, you expect to lose less than $10,000. It does not mean you cannot lose more than $10,000. It means that losses exceeding $10,000 should happen roughly one day out of twenty.
That is it. VaR is a single number that summarizes the left tail of your return distribution at a specific confidence level. It is not a worst-case scenario. It is not a guarantee. It is a statistical statement about the frequency of losses beyond a threshold.
Every major bank, hedge fund, and institutional investor uses VaR. After the 1994 derivatives blowups, JPMorgan published its RiskMetrics methodology and VaR became the industry standard. Understanding what it tells you, and critically what it does not, is necessary for anyone serious about risk management.
How VaR Is Calculated
There are three common approaches, and they give different answers:
Historical simulation. Take the last 500 days of actual portfolio returns. Sort them from worst to best. The 25th-worst day (the 5th percentile) is your 1-day 95% VaR. Simple, intuitive, and makes no assumptions about the shape of the return distribution. The weakness: it assumes the future will look like the recent past. If the last 500 days were unusually calm, your VaR will be artificially low.
Parametric (variance-covariance) method. Assume returns follow a normal distribution. Calculate the portfolio's standard deviation. Multiply by 1.65 (for 95% confidence) or 2.33 (for 99% confidence). Fast to compute and easy to decompose into risk contributions from individual positions. The weakness: returns are not normally distributed. They have fat tails, meaning extreme losses happen more frequently than a normal distribution predicts.
Monte Carlo simulation. Generate thousands of hypothetical return scenarios based on specified statistical properties. Measure the loss at your chosen confidence level. The most flexible method, it can handle non-linear instruments like options and complex correlation structures. The weakness: the results are only as good as the model assumptions you feed in. Garbage in, garbage out.
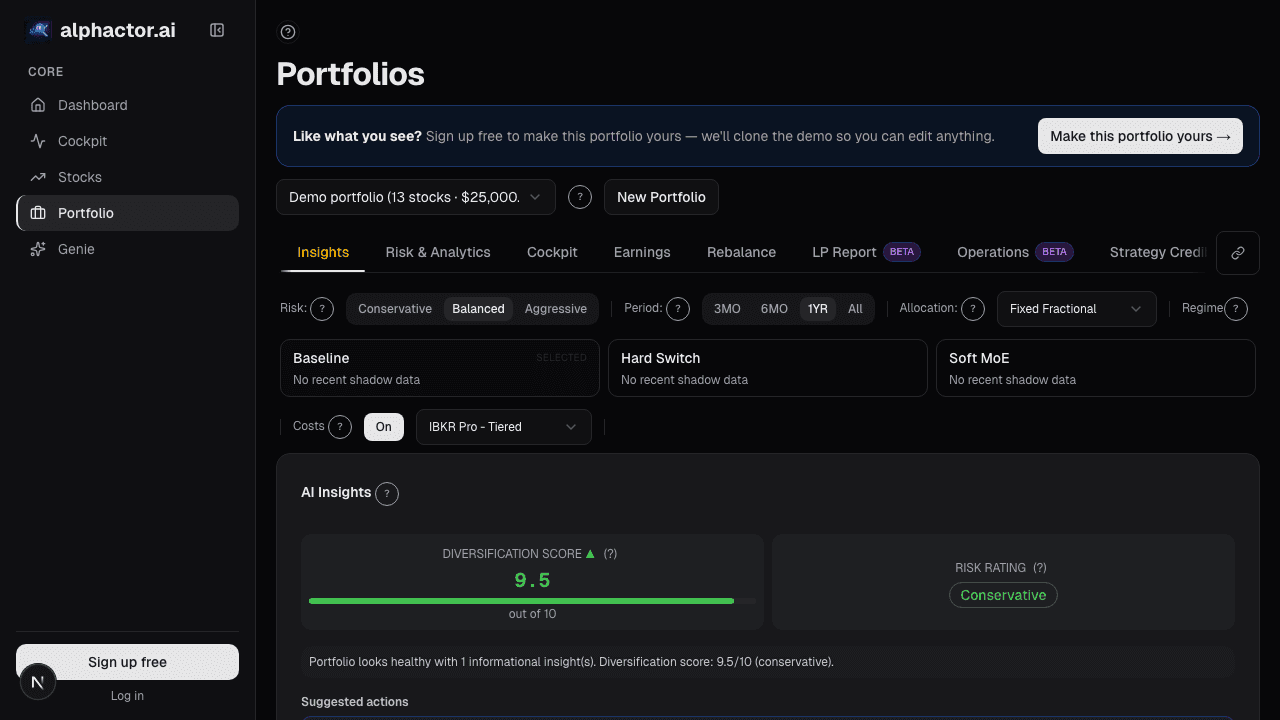
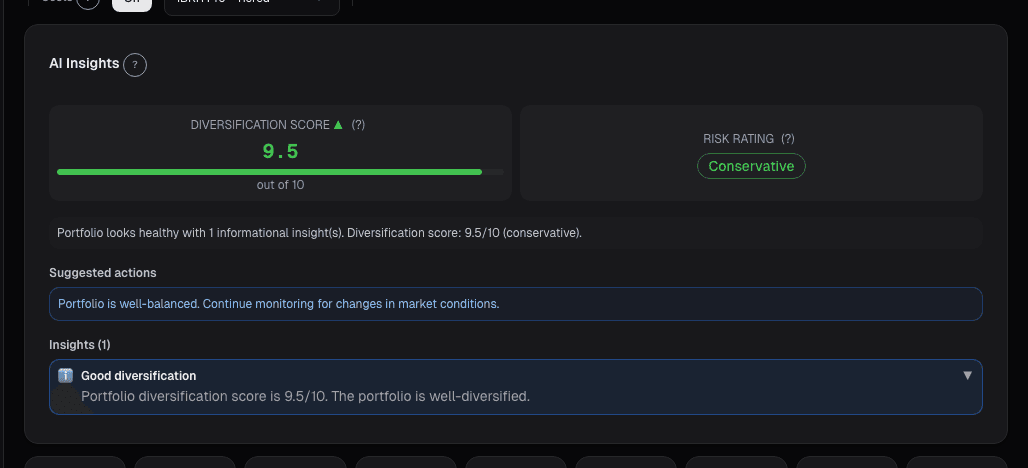
Alphactor's VaR calculations in the portfolio dashboard use historical simulation as the default because it requires the fewest assumptions, but offer parametric VaR for comparison. When the two numbers diverge significantly, it is a signal that current market conditions look different from the historical window, which is useful information on its own.
The Three Things VaR Hides
VaR is useful precisely because it is simple. But that simplicity comes with blind spots that have contributed to some of the largest losses in financial history.
Blind spot 1: It says nothing about the size of tail losses. A 95% VaR of $10,000 tells you that 5% of the time, you will lose more than $10,000. It says nothing about how much more. You could lose $11,000 or $500,000. The distribution beyond the VaR threshold is invisible. This is why risk managers also use Expected Shortfall (also called Conditional VaR), which measures the average loss in the tail. If your 95% VaR is $10,000 but your Expected Shortfall is $45,000, your tail risk is severe even though your VaR looks moderate.
Blind spot 2: It assumes yesterday's market conditions persist. All VaR methods rely on historical data or parameters estimated from recent history. When market regimes change, VaR adapts slowly. In the summer of 2008, VaR models at major banks showed moderate risk because the preceding years had been calm. By the time VaR caught up to the new reality, the losses had already happened. David Einhorn famously compared VaR to "an airbag that works all the time, except when you have a car accident."
Blind spot 3: It ignores liquidity. VaR assumes you can exit positions at current market prices. In a crisis, you cannot. If your VaR model says a position contributes $50,000 of risk but that position trades $20,000 per day in volume, your actual loss in a forced liquidation could be multiples of what VaR suggests. This is what destroyed Archegos in 2021: the VaR on their concentrated swap positions looked manageable until they tried to unwind and discovered there were no buyers at any reasonable price.
When VaR Is Useful
Despite its limitations, VaR remains valuable when used correctly:
Relative comparisons. VaR is excellent for tracking how your portfolio's risk changes over time. If your VaR doubled this month, something changed and you should understand what.
Position-level risk decomposition. Most VaR frameworks decompose total portfolio risk into contributions from individual positions. Alphactor's VaR breakdown shows which holdings are driving your overall risk, so you can decide whether that concentration is intentional. The fundamentals view provides the company-level data you need to evaluate whether a position's risk contribution is justified by its return potential.

Risk budgeting. Allocating VaR across strategies or positions ensures no single bet dominates your risk profile.
How to Use VaR Without Getting Burned
Treat VaR as a speedometer, not a crash-proof bumper. It tells you how fast you are going. It does not tell you what happens if you hit a wall. Always pair VaR with stress tests that model specific crisis scenarios. Always look at Expected Shortfall alongside VaR to understand tail severity. And never forget that VaR's biggest failure mode is complacency: a low VaR number can make you feel safe in exactly the conditions where safety is an illusion.
See it in the app
Live dashboard views that match this post. Each tile deep-links to the exact card.


Stocks mentioned
Related reading
Advanced Chart Analytics: Autocorrelation, Seasonality
Beyond moving averages and RSI lives a deeper layer of statistical diagnostics. Hurst exponent, autocorrelation, and seasonality tell you which strategies…
In a Crisis, All Correlations Go to One
Diversification fails exactly when you need it most. Here is why correlations spike during crises and how to build portfolios that survive it.
Portfolio Earnings: Calendar, Exposure
Earnings risk is about the whole book into the week, not each position. When 40% of NAV reports in one week, and 60% of that is in a single sector, you're…
Factor Exposure
Factor exposures are bets whether or not you chose them. Decomposition surfaces unintentional tilts before a rotation exposes them as underperformance.
FX Exposure: The Currency Risk Hiding in Your USD Portfolio
You bought US stocks in dollars, so you have no FX risk, right? Wrong. US large-cap multinationals earn 40-60% of revenue abroad.
Ready to try alphactor.ai?
Validate your trading strategies with statistical credibility testing. Start free.
Get Started Free